## Heatmap: Correlation Matrix
### Overview
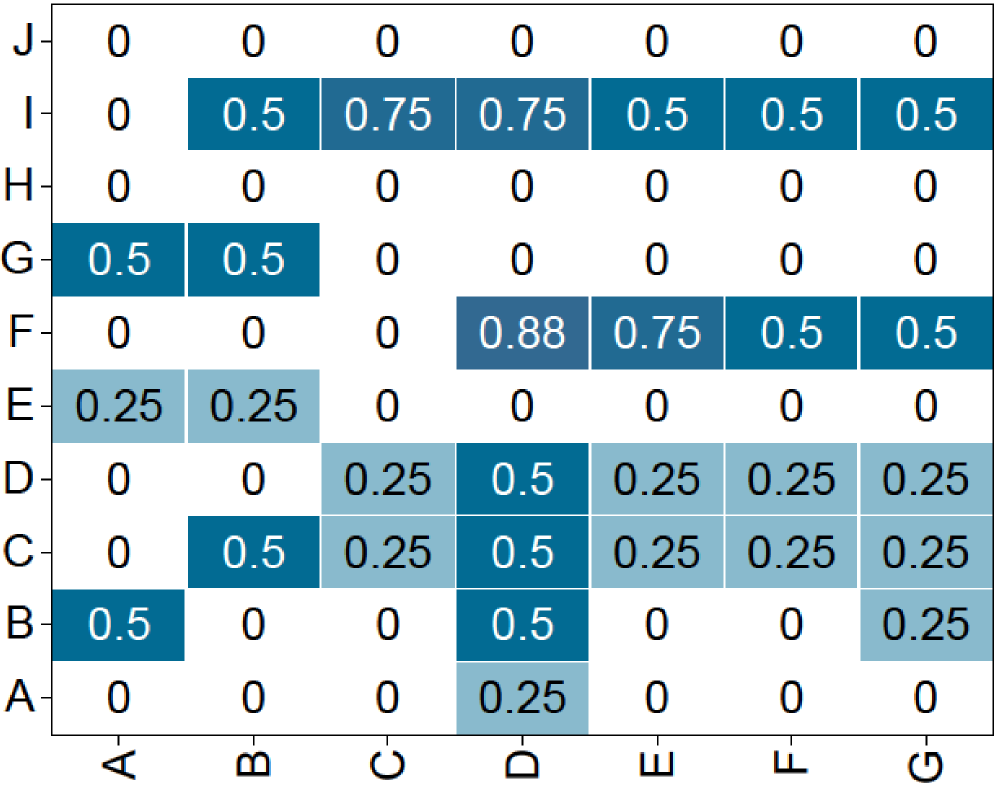
The image presents a heatmap representing a correlation matrix. The matrix displays the correlation coefficients between seven variables (A through G) across ten dimensions (A through J). The color intensity indicates the strength and direction of the correlation, with darker shades of blue representing stronger positive correlations and lighter shades representing weaker correlations or negative correlations. The values are numerical, ranging from 0 to 0.88.
### Components/Axes
* **X-axis:** Represents the variables, labeled A, B, C, D, E, F, and G.
* **Y-axis:** Represents the dimensions, labeled A, B, C, D, E, F, G, H, I, and J.
* **Color Scale:** The color scale is implicit, with darker blue indicating higher correlation and lighter blue/white indicating lower correlation. No explicit legend is provided, but the color gradient is clear.
* **Cells:** Each cell in the matrix represents the correlation coefficient between the corresponding variable (column) and dimension (row).
### Detailed Analysis
The matrix is 10x7. Here's a breakdown of the values, row by row:
* **Row A:** 0, 0, 0, 0.25, 0, 0, 0
* **Row B:** 0.5, 0.5, 0, 0.5, 0, 0, 0.25
* **Row C:** 0, 0.5, 0.25, 0.5, 0.25, 0.25, 0.25
* **Row D:** 0, 0, 0.25, 0.5, 0.25, 0.25, 0.25
* **Row E:** 0.25, 0.25, 0, 0, 0, 0, 0
* **Row F:** 0, 0, 0, 0.88, 0.75, 0.5, 0.5
* **Row G:** 0.5, 0.5, 0, 0, 0, 0, 0
* **Row H:** 0, 0, 0, 0, 0, 0, 0
* **Row I:** 0, 0.5, 0.75, 0.75, 0.5, 0.5, 0.5
* **Row J:** 0, 0, 0, 0, 0, 0, 0
**Trends:**
* **Variable F and Dimension D:** Exhibit the strongest positive correlation (0.88).
* **Variable F and Dimension E:** Show a strong positive correlation (0.75).
* **Variable I and Dimensions B, C, D, E, F, G:** Show moderate positive correlations (0.5 - 0.75).
* **Variable B and Dimension A:** Show a moderate positive correlation (0.5).
* **Variable G and Dimension A:** Show a moderate positive correlation (0.5).
* Many correlations are zero, indicating no linear relationship between the variables and dimensions.
### Key Observations
* The highest correlation value is 0.88, suggesting a strong linear relationship between Variable F and Dimension D.
* Dimension A appears to have limited correlation with most variables, except for B and G.
* Dimension H and J have zero correlation with all variables.
* The matrix is not symmetric, indicating that the correlation is not necessarily reciprocal.
### Interpretation
This correlation matrix likely represents the relationships between different features or variables within a dataset. The strong correlation between Variable F and Dimension D suggests that these two elements are closely related and tend to change together. The zero correlations indicate that some variables are independent of each other. The asymmetry of the matrix suggests that the relationship between variables is not always bidirectional.
The data suggests that Variable F is a strong predictor of Dimension D, and vice versa. The moderate correlations observed in Row I suggest that Dimension I is somewhat related to several variables, but not as strongly as F and D. The lack of correlation for Dimensions H and J might indicate that these dimensions are not relevant to the variables being analyzed, or that the relationship is non-linear.
Further investigation would be needed to understand the context of these variables and dimensions and to determine the practical implications of these correlations. For example, if these variables represent financial indicators, the correlations could be used to identify investment opportunities or to assess risk.