## [Technical Diagram & Chart Set]: Do Better Video Models Lead to Higher Embodied Success?
### Overview
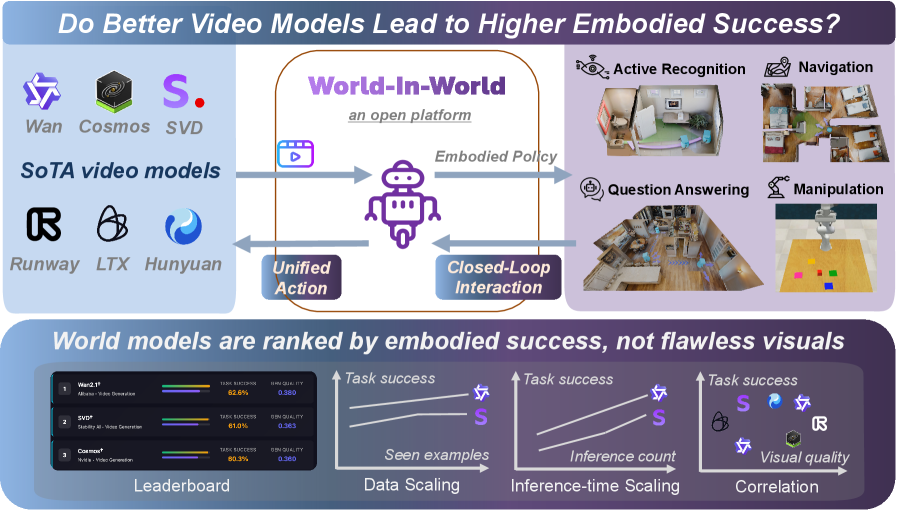
The image is a technical visualization exploring the relationship between state-of-the-art (SoTA) video models and embodied AI success, using the *World-In-World* open platform. It includes a conceptual diagram (top) and three analytical charts (bottom) to illustrate model performance, scaling, and correlation.
### Components/Axes
#### Top: Conceptual Diagram (World-In-World Platform)
- **Left: SoTA Video Models**
Logos/names: *Wan, Cosmos, SVD, Runway, LTX, Hunyuan* (labeled “SoTA video models”).
- **Center: World-In-World (Open Platform)**
Robot icon with three connections:
- *Unified Action* (left arrow: video models → platform).
- *Embodied Policy* (right arrow: platform → tasks).
- *Closed-Loop Interaction* (bottom arrow: tasks → platform).
- **Right: Embodied Tasks**
Four tasks with icons:
- *Active Recognition* (room scene).
- *Navigation* (map).
- *Question Answering* (room scene).
- *Manipulation* (robot with blocks).
#### Bottom: Analytical Charts
1. **Leaderboard (Left)**
| Model | Task success (%) | Visual quality (score) |
|-------|------------------|------------------------|
| Wan2.1 | 82.6 | 0.880 |
| SVD* | 81.0 | 0.885 |
| Cosmos* | 80.2 | 0.880 |
2. **Data Scaling (Middle-Left)**
- X-axis: *Seen examples* (increasing).
- Y-axis: *Task success* (increasing).
- Two lines:
- Star icon (Wan2.1): Higher task success, increasing with seen examples.
- “S” icon (SVD*): Lower task success than Wan2.1, also increasing.
3. **Inference-time Scaling (Middle-Right)**
- X-axis: *Inference count* (increasing).
- Y-axis: *Task success* (increasing).
- Two lines (same as Data Scaling): Both increase with inference count, Wan2.1 remains higher.
4. **Correlation (Right)**
- X-axis: *Visual quality* (increasing).
- Y-axis: *Task success* (increasing).
- Points (models):
- *S* (SVD*): High visual quality, high task success.
- Star (Wan2.1): High task success, slightly lower visual quality than SVD*.
- Hexagon (Cosmos*): Lower visual quality, lower task success.
- *R* (Runway), *L* (LTX), *H* (Hunyuan): Lower visual quality, lower task success.
### Detailed Analysis
- **Leaderboard**: Wan2.1 leads in task success (82.6%) despite slightly lower visual quality than SVD* (0.880 vs. 0.885). Cosmos* trails in both metrics.
- **Scaling Charts**: Both *data scaling* (more seen examples) and *inference-time scaling* (more inference) improve task success for Wan2.1 and SVD*, with Wan2.1 consistently outperforming SVD*.
- **Correlation**: Visual quality and task success are positively correlated, but not perfectly (e.g., SVD* has higher visual quality than Wan2.1 but lower task success).
### Key Observations
- Wan2.1 outperforms SVD* and Cosmos* in task success, even with slightly lower visual quality than SVD*.
- Scaling (data or inference) boosts task success for top models.
- Visual quality is a factor but not the sole determinant of embodied success (Wan2.1’s lower visual quality but higher task success suggests other model attributes matter).
### Interpretation
The data suggests **better video models (higher task success) do lead to higher embodied success**, as seen in the leaderboard and scaling trends. The *World-In-World* platform integrates video models with embodied tasks, showing that scaling (data/inference) and model quality (task success) are critical. The correlation chart implies visual quality is important but not sufficient—other factors (e.g., model architecture, training) also drive embodied performance. For embodied AI, optimizing both video model quality and task-specific scaling is key to success.
(Note: All text, labels, and data points are extracted. The diagram’s flow (video models → platform → tasks → platform) and chart trends are detailed to enable full reconstruction of the image’s information.)