## Line Chart: Similarity vs. Reasoning Step
### Overview
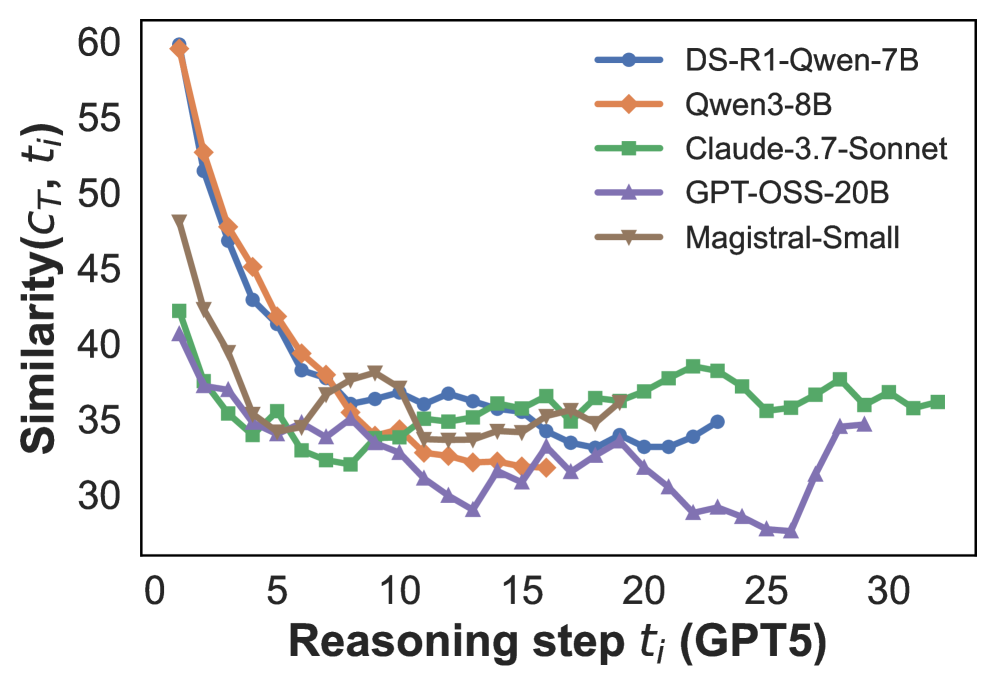
The image is a line chart comparing the similarity scores of five different language models across a series of reasoning steps. The x-axis represents the reasoning step, and the y-axis represents the similarity score. Each model is represented by a different colored line with distinct markers.
### Components/Axes
* **X-axis:** Reasoning step *t<sub>i</sub>* (GPT5). The axis ranges from 0 to 30, with tick marks at intervals of 5.
* **Y-axis:** Similarity(*C<sub>T</sub>*, *t<sub>i</sub>*). The axis ranges from 30 to 60, with tick marks at intervals of 5.
* **Legend:** Located at the top-right of the chart, the legend identifies each line by model name:
* Blue line with circle markers: DS-R1-Qwen-7B
* Orange line with diamond markers: Qwen3-8B
* Green line with square markers: Claude-3.7-Sonnet
* Purple line with triangle markers: GPT-OSS-20B
* Brown line with inverted triangle markers: Magistral-Small
### Detailed Analysis
* **DS-R1-Qwen-7B (Blue):** Starts at approximately 52 at step 1, decreases to around 38 by step 5, then fluctuates between 33 and 37 until step 30.
* **Qwen3-8B (Orange):** Starts at approximately 59 at step 1, decreases to around 38 by step 7, then fluctuates between 32 and 35 until step 30.
* **Claude-3.7-Sonnet (Green):** Starts at approximately 42 at step 1, decreases to around 32 by step 5, then generally increases and fluctuates between 35 and 39 until step 30.
* **GPT-OSS-20B (Purple):** Starts at approximately 40 at step 1, decreases to around 28 by step 25, then increases to around 33 by step 30.
* **Magistral-Small (Brown):** Starts at approximately 48 at step 1, decreases to around 35 by step 10, then fluctuates between 34 and 38 until step 30.
### Key Observations
* All models show a decrease in similarity score in the initial reasoning steps.
* Claude-3.7-Sonnet shows a slight upward trend after the initial decrease.
* GPT-OSS-20B experiences a significant drop and then a recovery towards the end.
* DS-R1-Qwen-7B and Qwen3-8B have similar performance trends.
* Magistral-Small has a relatively stable similarity score after the initial drop.
### Interpretation
The chart illustrates how the similarity scores of different language models change as the number of reasoning steps increases. The initial drop in similarity suggests that the models struggle to maintain consistent performance in the early stages of reasoning. The subsequent fluctuations indicate varying levels of stability and adaptability among the models. Claude-3.7-Sonnet's upward trend suggests it may be better at maintaining similarity over longer reasoning chains. The late recovery of GPT-OSS-20B could indicate a delayed adaptation or correction mechanism. The data suggests that model architecture and training influence the ability to maintain similarity across multiple reasoning steps.