\n
## Line Chart: Benchmark: AIME'25
### Overview
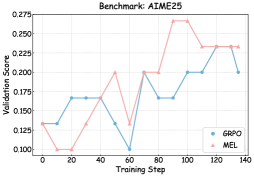
The image displays a line chart comparing the validation score performance of two methods, GAPO and MEL, over the course of training steps. The chart tracks how the validation score for each method changes as training progresses from step 0 to step 140.
### Components/Axes
* **Chart Title:** "Benchmark: AIME'25" (centered at the top).
* **Y-Axis:** Labeled "Validation Score". The scale runs from 0.100 to 0.275, with major tick marks at intervals of 0.025 (0.100, 0.125, 0.150, 0.175, 0.200, 0.225, 0.250, 0.275).
* **X-Axis:** Labeled "Training Step". The scale runs from 0 to 140, with major tick marks at intervals of 20 (0, 20, 40, 60, 80, 100, 120, 140).
* **Legend:** Located in the bottom-right corner of the chart area.
* **GAPO:** Represented by a blue line with circular markers.
* **MEL:** Represented by a red line with square markers.
* **Grid:** A light gray grid is present, aligning with the major ticks on both axes.
### Detailed Analysis
**Data Series: GAPO (Blue Line, Circle Markers)**
* **Trend:** The line shows significant volatility, with sharp rises and falls throughout the training steps. It does not exhibit a consistent upward or downward trend but rather fluctuates within a range.
* **Approximate Data Points:**
* Step 0: ~0.135
* Step 20: ~0.170
* Step 40: ~0.170
* Step 60: ~0.125
* Step 80: ~0.200
* Step 100: ~0.170
* Step 120: ~0.200
* Step 140: ~0.200
**Data Series: MEL (Red Line, Square Markers)**
* **Trend:** The line shows a more pronounced overall upward trend, especially after step 60, culminating in a significant peak. It experiences a notable dip early on (step 20) before climbing.
* **Approximate Data Points:**
* Step 0: ~0.100
* Step 20: ~0.090
* Step 40: ~0.150
* Step 60: ~0.200
* Step 80: ~0.175
* Step 100: ~0.270 (Peak)
* Step 120: ~0.230
* Step 140: ~0.230
### Key Observations
1. **Performance Crossover:** The two methods trade the lead multiple times. MEL starts lower, surpasses GAPO around step 60, falls behind again at step 80, and then decisively overtakes GAPO from step 100 onward.
2. **Peak Performance:** The highest validation score on the chart is achieved by MEL at step 100 (~0.270).
3. **Volatility vs. Growth:** GAPO's performance is highly variable without clear growth. MEL, despite an early dip and a drop after its peak, demonstrates a stronger capacity for high scores in the later stages of training.
4. **Final Convergence:** By step 140, both methods have converged to similar scores (~0.200 for GAPO, ~0.230 for MEL), though MEL maintains a slight advantage.
### Interpretation
The chart suggests that for the "AIME'25" benchmark, the MEL training method has a higher potential peak performance than GAPO, as evidenced by its score of ~0.270. However, MEL's learning trajectory is less stable, featuring a significant dip early in training and a sharp decline after its peak. GAPO, while never reaching the same heights, shows a pattern of recovering from drops (e.g., after step 60 and step 100).
The data implies a trade-off: MEL may be preferable if the goal is to achieve the highest possible score and training can be stopped at an optimal point (around step 100). GAPO might be considered for scenarios where consistent, moderate performance is valued over peak potential, though its volatility contradicts strict consistency. The final convergence suggests that extended training beyond 100-120 steps may diminish the performance gap between the two methods on this specific benchmark. The sharp peak for MEL at step 100 is a critical anomaly that warrants investigation—it could represent a genuine breakthrough in learning or an instability in the validation process.