## Line Chart: Benchmark: AIME25
### Overview
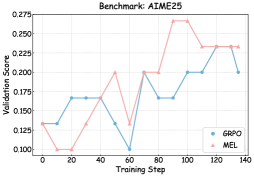
The chart compares the validation scores of two models, **GRPO** (blue line) and **MEL** (red line), across 140 training steps. Both lines exhibit fluctuating trends with notable peaks and troughs, suggesting dynamic performance changes during training.
### Components/Axes
- **X-axis (Training Step)**: Ranges from 0 to 140 in increments of 20.
- **Y-axis (Validation Score)**: Ranges from 0.100 to 0.275 in increments of 0.025.
- **Legend**: Located in the bottom-right corner, with:
- **GRPO**: Blue line (circle markers).
- **MEL**: Red line (triangle markers).
### Detailed Analysis
#### GRPO (Blue Line)
- **Initial Phase (0–40 steps)**: Starts at ~0.13, rises to ~0.17 by step 20, then plateaus until step 40 (~0.17).
- **Mid-Phase (40–80 steps)**: Drops sharply to ~0.10 at step 60, then rises to ~0.20 by step 80.
- **Final Phase (80–140 steps)**: Stabilizes around ~0.20, with minor fluctuations.
#### MEL (Red Line)
- **Initial Phase (0–40 steps)**: Begins at ~0.12, dips to ~0.10 at step 20, then rises to ~0.20 by step 40.
- **Mid-Phase (40–80 steps)**: Peaks at ~0.25 at step 80, then drops to ~0.12 at step 60.
- **Final Phase (80–140 steps)**: Rises to ~0.26 at step 100, dips slightly to ~0.23 by step 140.
### Key Observations
1. **Crossing Points**: The lines intersect near step 60, where GRPO reaches its lowest point (~0.10) and MEL recovers from a dip.
2. **Peaks**: MEL achieves the highest validation score (~0.26) at step 100, while GRPO peaks at ~0.20 at step 80.
3. **Volatility**: MEL shows greater variability, with sharper rises and falls compared to GRPO’s more stable trajectory after step 80.
4. **Final Values**: At step 140, GRPO stabilizes at ~0.20, while MEL ends at ~0.23.
### Interpretation
The chart highlights trade-offs between the two models:
- **GRPO** demonstrates consistent performance after step 80, suggesting robustness in later training stages.
- **MEL** exhibits higher peaks but greater instability, potentially indicating overfitting or sensitivity to training dynamics. The sharp dip at step 60 may reflect a temporary setback or optimization challenge.
- The divergence at step 100 (MEL’s peak vs. GRPO’s plateau) suggests MEL may prioritize short-term gains over sustained performance, while GRPO balances stability and moderate improvement.
This analysis underscores the importance of model selection based on training objectives: MEL for high-risk, high-reward scenarios, and GRPO for reliable, steady progress.