## Scatter Plot: MathVision Pass@1 vs. Activated Parameters
### Overview
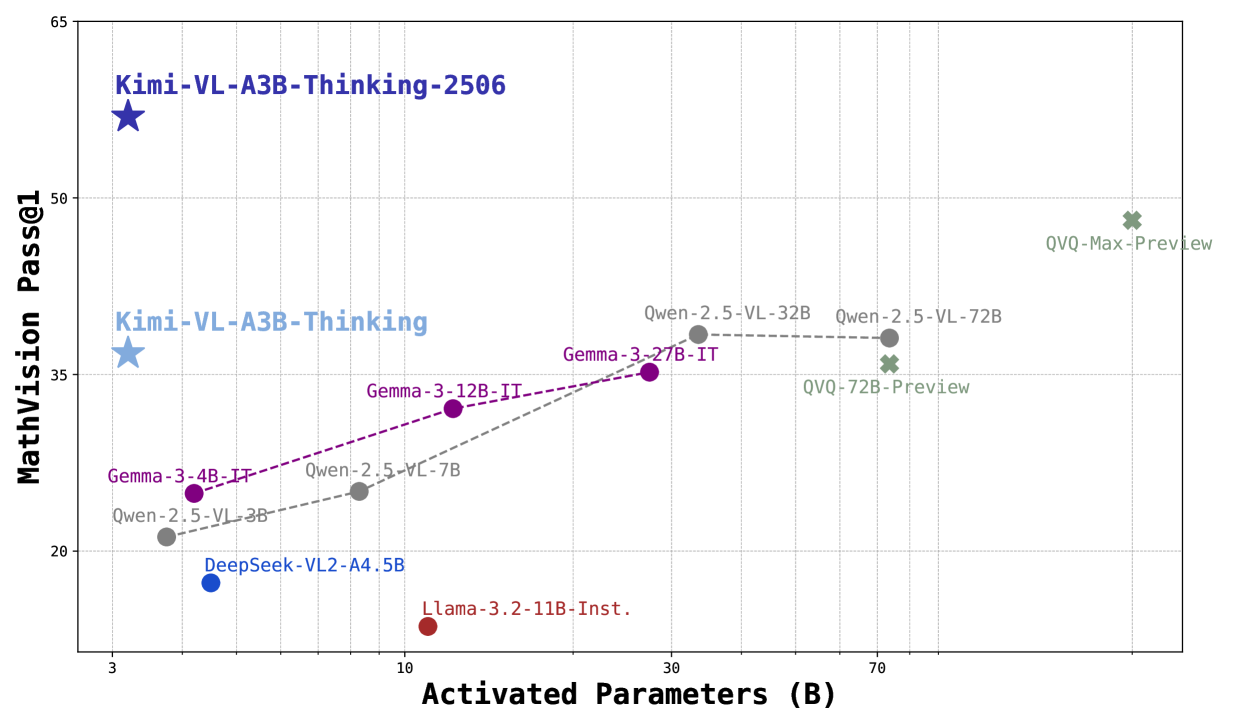
The image is a scatter plot comparing the performance of various language models on the MathVision Pass@1 benchmark against the number of activated parameters (in billions). The plot displays data points for different models, each labeled with its name, and uses different colors to distinguish between model families. Trend lines connect related models.
### Components/Axes
* **X-axis:** Activated Parameters (B), with a logarithmic scale. Axis markers are present at approximately 3, 10, 30, and 70.
* **Y-axis:** MathVision Pass@1, with a linear scale. Axis markers are present at 20, 35, 50, and 65.
* **Data Points:** Each data point represents a specific language model. The models are labeled with their names (e.g., "Kimi-VL-A3B-Thinking-2506", "Gemma-3-4B-IT", "Qwen-2.5-VL-3B").
* **Trend Lines:** Dashed lines connect related models, showing the trend in performance as the number of activated parameters increases. There are two trend lines: one for the Gemma models (purple) and one for the Qwen models (gray).
* **Legend:** There is no explicit legend, but the colors of the data points implicitly represent different model families.
### Detailed Analysis
* **Kimi-VL-A3B-Thinking-2506 (Dark Blue Star):** Located at approximately (3, 60).
* **Kimi-VL-A3B-Thinking (Light Blue Star):** Located at approximately (3, 37).
* **Gemma-3-4B-IT (Purple Dot):** Located at approximately (4, 25).
* **Gemma-3-12B-IT (Purple Dot):** Located at approximately (12, 33).
* **Gemma-3-27B-IT (Purple Dot):** Located at approximately (28, 36).
* **Trend:** The Gemma models show an upward trend, with performance increasing as the number of activated parameters increases.
* **Qwen-2.5-VL-3B (Gray Dot):** Located at approximately (5, 22).
* **Qwen-2.5-VC-7B (Gray Dot):** Located at approximately (11, 27).
* **Qwen-2.5-VL-32B (Gray Dot):** Located at approximately (35, 38).
* **Qwen-2.5-VL-72B (Gray Dot):** Located at approximately (75, 38).
* **Trend:** The Qwen models show an upward trend initially, but performance plateaus after 32B parameters.
* **DeepSeek-VL2-A4.5B (Blue Dot):** Located at approximately (6, 18).
* **Llama-3.2-11B-Inst. (Red Dot):** Located at approximately (12, 15).
* **QVQ-72B-Preview (Green X):** Located at approximately (75, 33).
* **QVQ-Max-Preview (Green X):** Located at approximately (75, 48).
### Key Observations
* The Kimi models, represented by stars, outperform other models with similar numbers of activated parameters.
* The Gemma models show a consistent increase in performance with increasing parameters.
* The Qwen models plateau in performance after a certain number of parameters.
* The QVQ models show a significant jump in performance compared to the Qwen models, despite having similar numbers of parameters.
* The DeepSeek and Llama models have relatively low MathVision Pass@1 scores compared to other models.
### Interpretation
The scatter plot illustrates the relationship between model size (activated parameters) and performance on the MathVision Pass@1 benchmark. The data suggests that increasing model size generally leads to better performance, but there are diminishing returns for some model families (e.g., Qwen). The Kimi and QVQ models appear to be more efficient, achieving higher performance with fewer parameters compared to other models. The plot highlights the importance of model architecture and training techniques in addition to model size. The plateauing of the Qwen models suggests that simply increasing the number of parameters may not always lead to significant improvements in performance.