## Heatmap: Loudspeaker Acoustic Transfer Function \( S_A(\nu, \theta) \)
### Overview
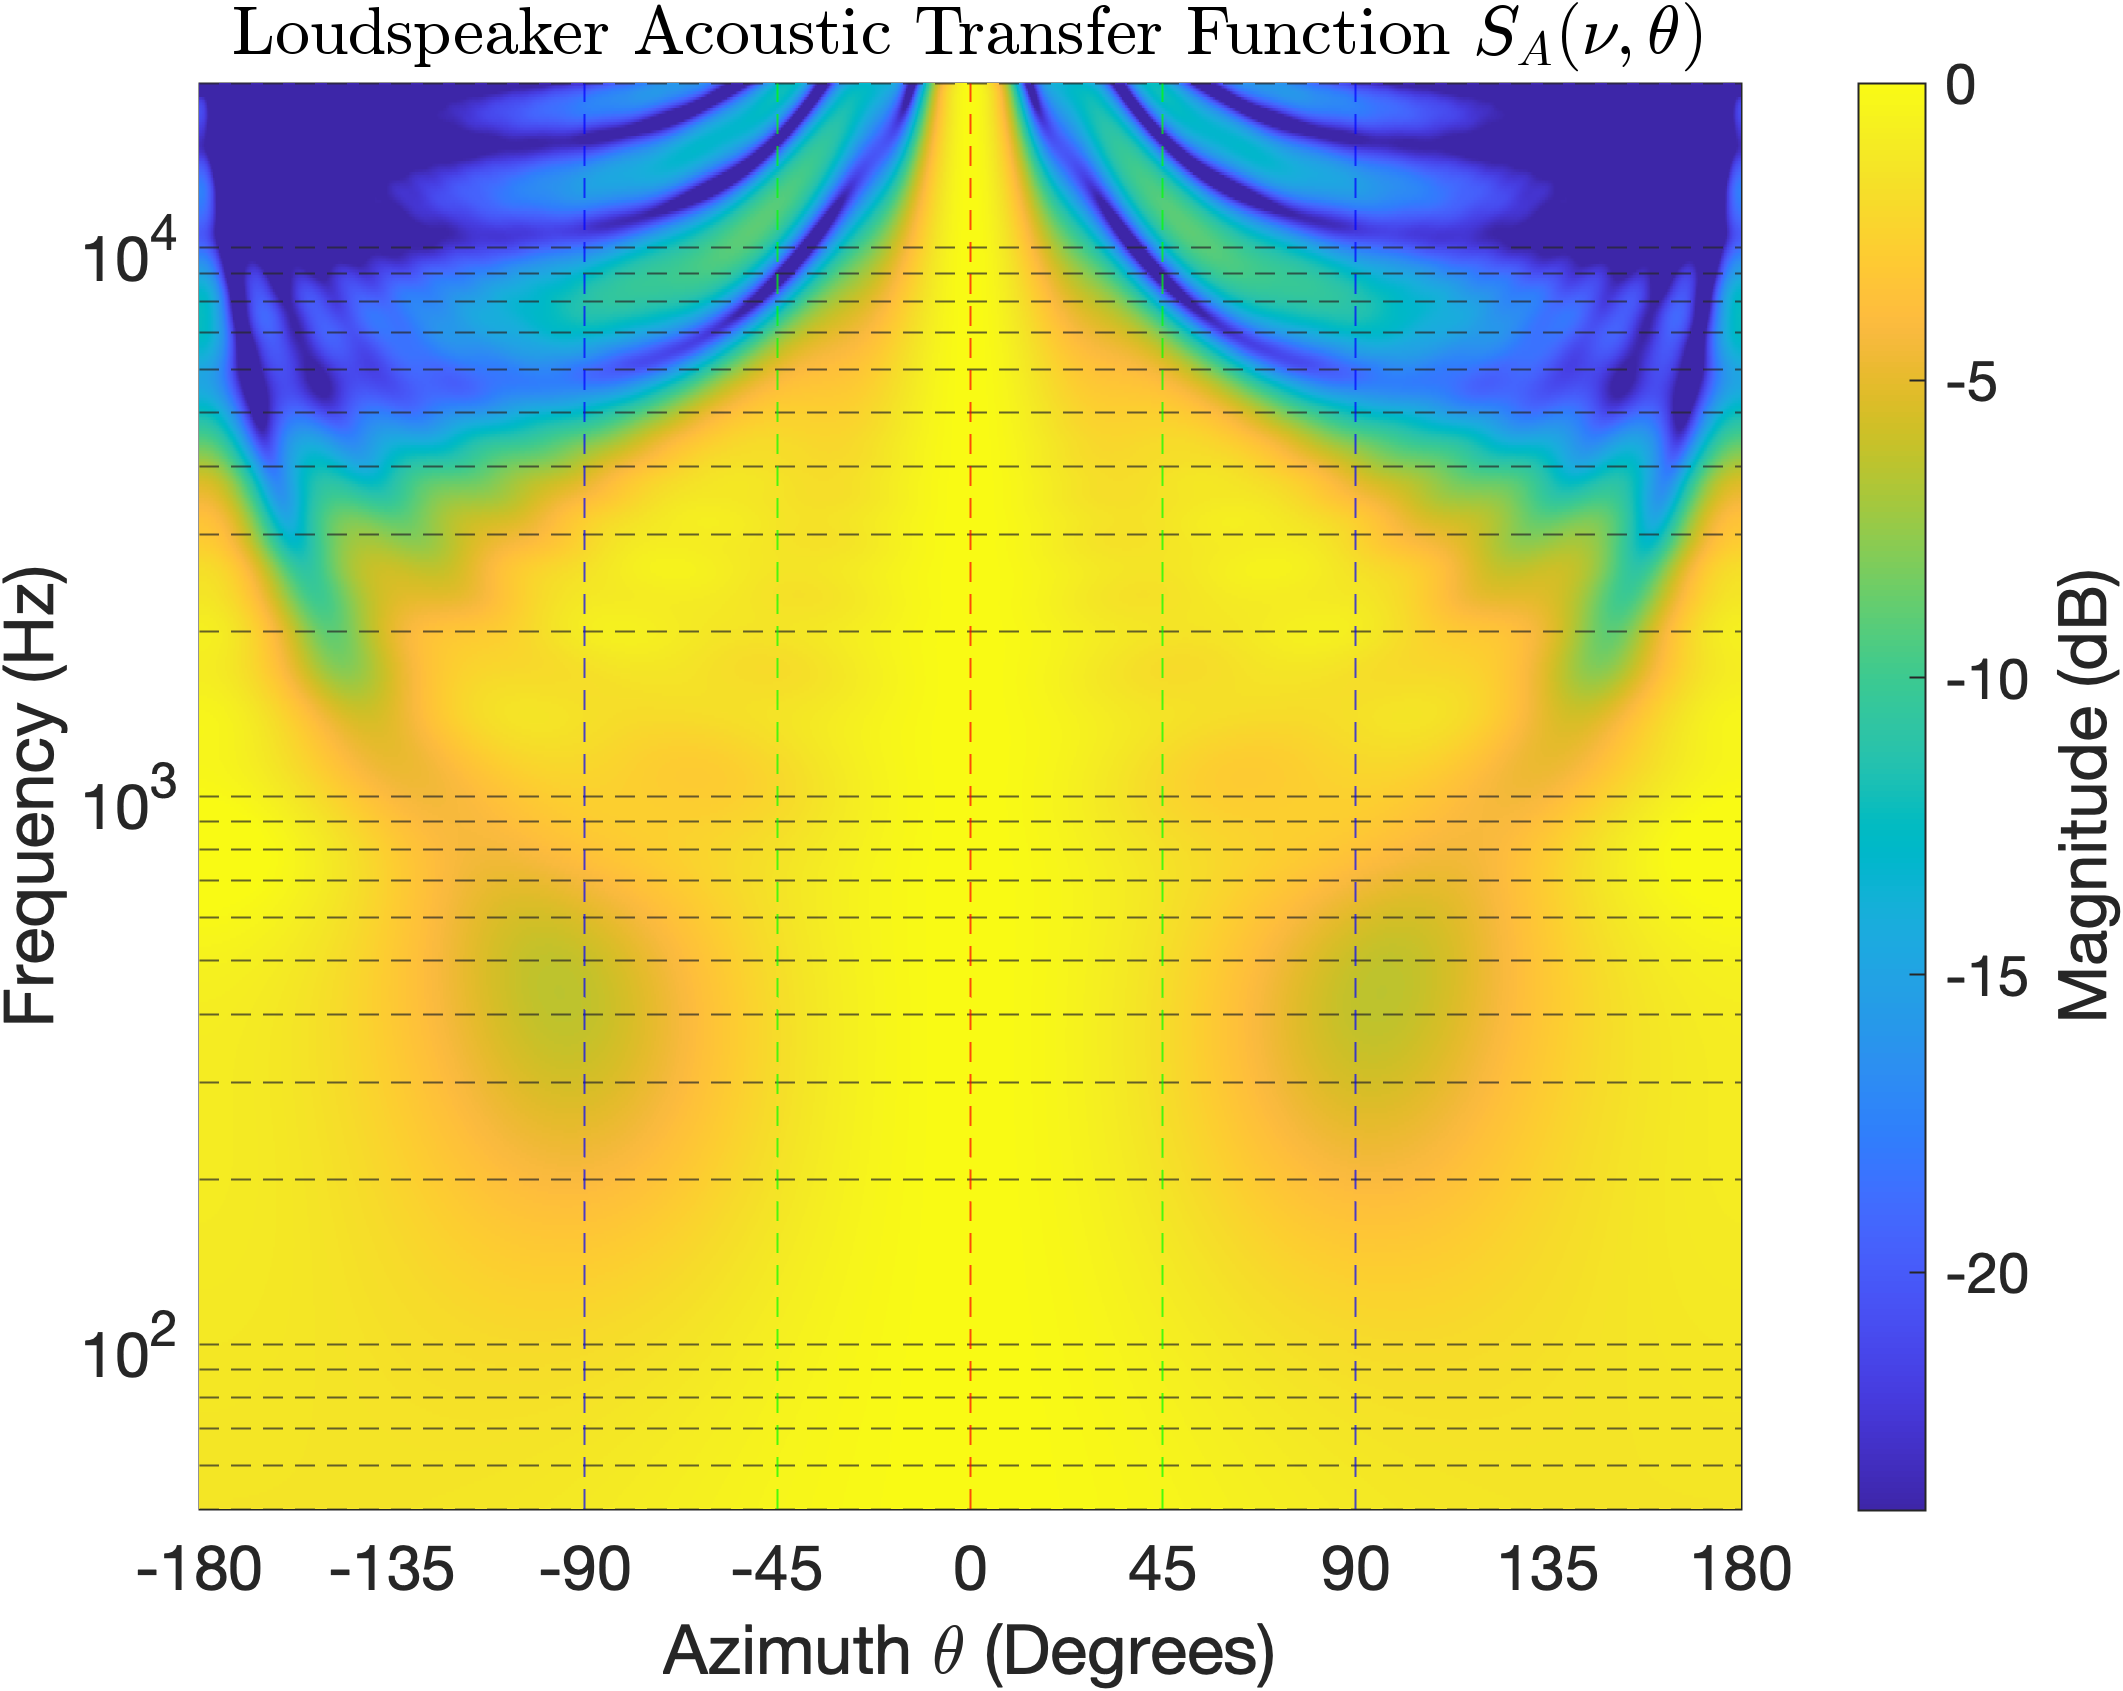
The image is a heatmap visualizing the magnitude of a loudspeaker's acoustic transfer function across frequency (Hz) and azimuth angle (degrees). The color gradient represents sound pressure level (dB), with blue indicating lower magnitudes and yellow higher magnitudes. The plot uses a logarithmic frequency scale and spans a full 360° azimuth range.
---
### Components/Axes
1. **X-Axis (Azimuth θ)**:
- Label: "Azimuth θ (Degrees)"
- Range: -180° to 180° (full circle)
- Key markers: Solid vertical lines at -180°, -90°, 0°, 90°, 180°; dashed lines at intermediate intervals.
2. **Y-Axis (Frequency)**:
- Label: "Frequency (Hz)"
- Scale: Logarithmic (10² to 10⁴ Hz)
- Key markers: Horizontal dashed lines at 100 Hz, 1 kHz, 10 kHz.
3. **Color Bar (Magnitude)**:
- Label: "Magnitude (dB)"
- Range: -20 dB (blue) to 0 dB (yellow)
- Position: Right of the plot.
4. **Grid**:
- Dashed black lines for frequency and azimuth subdivisions.
- Solid lines at critical points (e.g., 0°, ±90°, ±180°).
---
### Detailed Analysis
- **Color Gradient**:
- Blue (-20 dB) to yellow (0 dB) indicates decreasing sound magnitude.
- Central region (0° azimuth) is predominantly yellow, suggesting maximum transfer.
- Blue lobes appear near ±90° azimuth at higher frequencies (1 kHz–10 kHz).
- **Frequency Trends**:
- **Low frequencies (100–1 kHz)**: Uniform yellow across most azimuths, except near ±90° where faint blue regions emerge.
- **Mid frequencies (1–10 kHz)**: Strong blue lobes at ±90°, indicating directional attenuation.
- **High frequencies (10 kHz–100 kHz)**: Blue lobes dominate, with minimal yellow regions.
- **Azimuth Trends**:
- **0° azimuth**: Consistently yellow (highest magnitude) across all frequencies.
- **±90° azimuth**: Blue regions (lowest magnitude) become more pronounced at higher frequencies.
---
### Key Observations
1. **Directional Sensitivity**:
- The loudspeaker exhibits strong directional behavior at higher frequencies, with significant attenuation at ±90° azimuth.
- At lower frequencies, the response is more omnidirectional.
2. **Resonance Peaks**:
- Yellow regions near 0° azimuth suggest resonant frequencies where sound is amplified.
3. **Logarithmic Scale Impact**:
- The logarithmic frequency axis emphasizes relative changes in magnitude, highlighting directional effects at higher frequencies.
---
### Interpretation
The heatmap demonstrates that the loudspeaker’s acoustic performance is highly directional at higher frequencies, with a pronounced "null" (attenuation) at ±90° azimuth. This suggests the speaker is optimized for frontal sound projection, with reduced performance at side angles. The logarithmic frequency scale reveals that directional effects become more critical as frequency increases, which is critical for applications like concert hall acoustics or directional audio systems. The central axis (0°) consistently shows maximum transfer, indicating the speaker’s primary design focus on frontal sound delivery.