\n
## Diagram: Causal Loop Diagram - Evidence and Innocence
### Overview
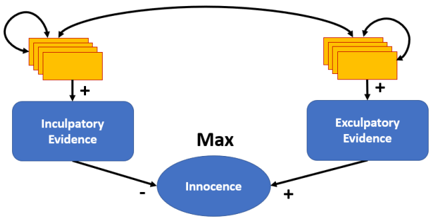
The image presents a causal loop diagram illustrating the relationship between inculpatory evidence, exculpatory evidence, and a belief in innocence. The diagram uses rounded rectangles to represent variables and arrows to indicate causal relationships, with "+" and "-" signs denoting positive and negative influences, respectively. The central variable is "Innocence," with "Max" written above it.
### Components/Axes
The diagram consists of the following components:
* **Innocence:** A large, oval-shaped node in the center, colored blue.
* **Inculpatory Evidence:** A rectangular node on the left, colored blue.
* **Exculpatory Evidence:** A rectangular node on the right, colored blue.
* **Evidence Stacks:** Two stacks of smaller, rectangular nodes colored yellow, positioned above "Inculpatory Evidence" and "Exculpatory Evidence" respectively. These represent the accumulation of evidence.
* **Arrows:** Black arrows indicating causal relationships.
* **Signs:** "+" and "-" signs along the arrows, indicating positive and negative influences.
* **Text:** "Max" positioned above the "Innocence" node.
### Detailed Analysis / Content Details
The diagram shows the following causal relationships:
1. **Inculpatory Evidence -> Innocence:** A negative influence ("-") indicates that an increase in inculpatory evidence *decreases* belief in innocence.
2. **Exculpatory Evidence -> Innocence:** A positive influence ("+") indicates that an increase in exculpatory evidence *increases* belief in innocence.
3. **Innocence -> Inculpatory Evidence:** A positive influence ("+") indicates that a stronger belief in innocence *increases* the search for or interpretation of inculpatory evidence.
4. **Innocence -> Exculpatory Evidence:** A negative influence ("-") indicates that a stronger belief in innocence *decreases* the search for or interpretation of exculpatory evidence.
5. **Evidence Stacks -> Inculpatory/Exculpatory Evidence:** Arrows from the yellow evidence stacks to the respective evidence nodes indicate that the accumulation of evidence influences the amount of that type of evidence.
6. **Loops:** There are two feedback loops:
* A reinforcing loop between Innocence, Inculpatory Evidence, and back to Innocence.
* A balancing loop between Innocence, Exculpatory Evidence, and back to Innocence.
### Key Observations
The diagram illustrates a system where belief in innocence can be self-reinforcing (through seeking out inculpatory evidence) or self-correcting (through seeking out exculpatory evidence). The presence of "Max" above "Innocence" suggests a potential upper limit or threshold for the belief in innocence. The diagram highlights the potential for confirmation bias, where existing beliefs influence the interpretation of evidence.
### Interpretation
This diagram represents a simplified model of how evidence influences perceptions of guilt or innocence. The positive feedback loop involving inculpatory evidence suggests that once a belief in guilt begins to form, it can be reinforced by selectively attending to evidence that supports that belief. Conversely, the balancing loop involving exculpatory evidence suggests that a strong belief in innocence can lead to a search for evidence that confirms that belief, potentially mitigating the impact of incriminating evidence. The "Max" label implies that there is a limit to how strongly someone can believe in innocence, even in the face of overwhelming evidence. This model is relevant to understanding biases in legal proceedings, investigations, and everyday decision-making. The diagram is a conceptual model and does not provide quantitative data. It is a qualitative representation of causal relationships.