\n
## Diagram: Heart Failure Diagnostic Pathway
### Overview
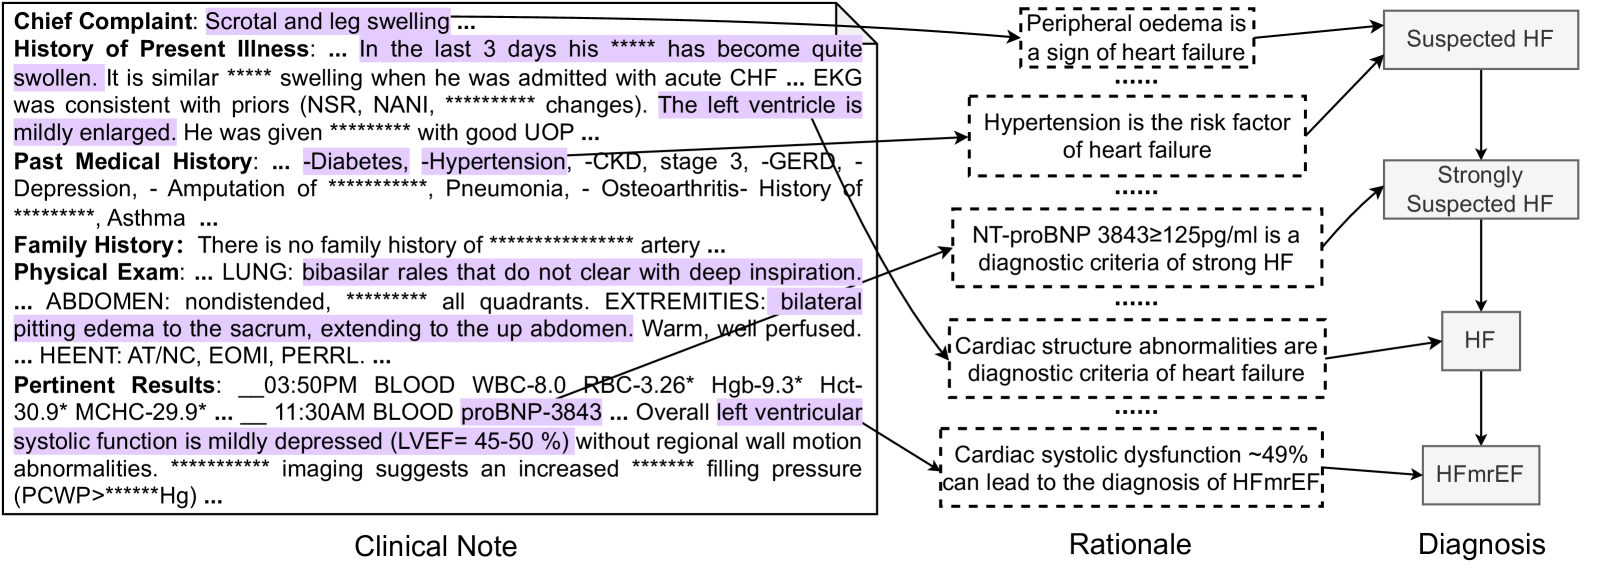
The image presents a diagram outlining a diagnostic pathway for heart failure (HF). It visually connects clinical notes (patient history and examination findings) to rationales for suspicion and ultimately to a diagnosis. The diagram uses a flow-chart style with boxes representing clinical notes, rationales, and diagnoses, connected by arrows indicating progression. Significant portions of the text are obscured by asterisks ("****").
### Components/Axes
The diagram is divided into three main columns:
1. **Clinical Note:** (Left) Contains patient medical information.
2. **Rationale:** (Center) Lists reasons supporting a diagnosis.
3. **Diagnosis:** (Right) Presents potential diagnoses.
There are no explicit axes in the traditional sense. The flow is directional, moving from left to right.
### Detailed Analysis or Content Details
**Clinical Note (Left Column):**
* **Chief Complaint:** Scrotal and leg swelling.
* **History of Present Illness:** In the last 3 days, swelling has become quite swollen. EKG was consistent with priors (NSR, changes). The left ventricle is mildly enlarged. Patient had good UOP (urine output).
* **Past Medical History:** Diabetes, Hypertension, CKD stage 3, GERD, Depression, Amputation, Pneumonia, Osteoarthritis, History of Asthma.
* **Family History:** No family history of artery.
* **Physical Exam:** LUNG: bibasilar rales that do not clear with deep inspiration. ABDOMEN: nondistended, all quadrants. EXTREMITIES: bilateral pitting edema to the sacrum, extending to the up abdomen. Warm, well perfused. HEENT: AT/NC, EOMI, PERRL.
* **Pertinent Results:** 03:50PM BLOOD WBC-8.0 RBC-3.26* Hgb-9.3* Hct-30.9* MCHC-29.9*. 11:30AM blood proBNP-3843. Overall left ventricular systolic function is mildly depressed (LVEF= 45-50%) without regional wall motion abnormalities. Imaging suggests an increased filling pressure (PCWP=**** Hg).
**Rationale (Center Column):**
* Peripheral oedema is a sign of heart failure.
* Hypertension is the risk factor of heart failure.
* NT-proBNP 3843±125pg/ml is a diagnostic criteria of strong HF.
* Cardiac structure abnormalities are diagnostic criteria of heart failure.
* Cardiac systolic dysfunction ~49% can lead to the diagnosis of HFmrEF.
**Diagnosis (Right Column):**
* Suspected HF (connected to Peripheral oedema rationale)
* Strongly Suspected HF (connected to NT-proBNP rationale)
* HF (connected to Cardiac structure abnormalities rationale)
* HFmrEF (connected to Cardiac systolic dysfunction rationale)
### Key Observations
* The diagram illustrates a stepwise diagnostic approach.
* The proBNP level of 3843 pg/ml is highlighted as a strong indicator of heart failure.
* The LVEF (Left Ventricular Ejection Fraction) is mildly depressed at 45-50%, contributing to the HFmrEF diagnosis.
* Multiple clinical findings (edema, hypertension, structural abnormalities, systolic dysfunction) contribute to the diagnostic process.
* Significant portions of the clinical data are obscured, limiting a complete assessment.
### Interpretation
The diagram demonstrates a clinical reasoning process for diagnosing heart failure. The pathway begins with patient presentation (chief complaint and history) and progresses through examination findings and laboratory results. These findings are then linked to established rationales for suspecting HF, ultimately leading to a diagnosis. The diagram emphasizes the importance of multiple data points (clinical signs, biomarkers, imaging) in arriving at a diagnosis. The progression from "Suspected HF" to "Strongly Suspected HF" and finally to specific HF subtypes (HF and HFmrEF) reflects increasing confidence in the diagnosis based on accumulating evidence. The obscured data points ("****") represent missing information that would provide a more complete clinical picture. The diagram is a simplified representation of a complex clinical process, but it effectively illustrates the key elements involved in HF diagnosis. The use of a flow-chart format makes the pathway easy to follow and understand.