## Diagram: Workflows for Generating a Data-driven Visual Storytelling
### Overview
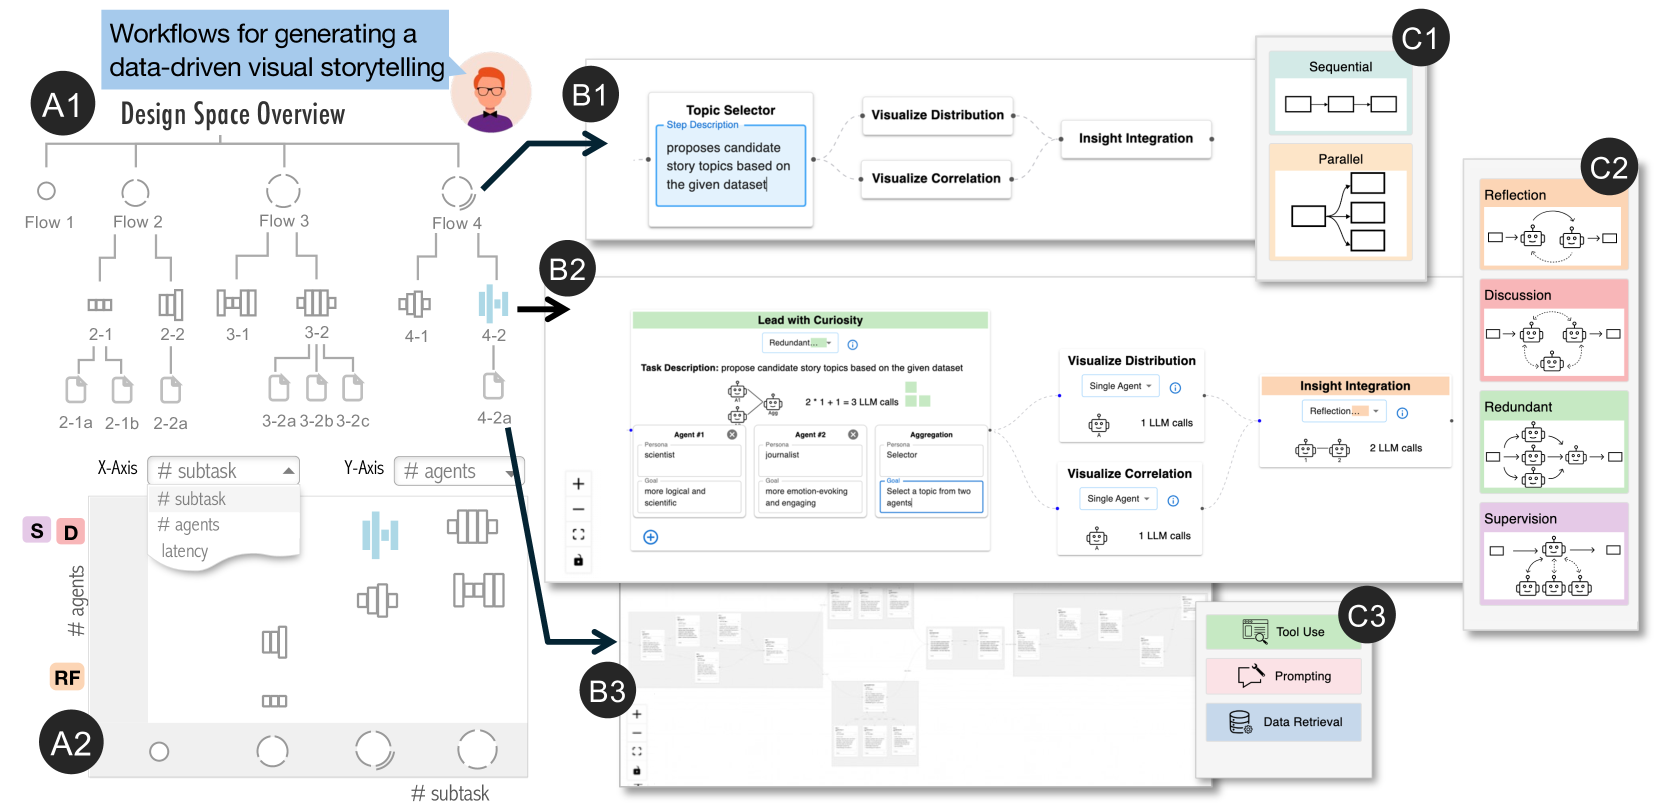
This diagram illustrates workflows for generating data-driven visual storytelling, encompassing design space overview, topic selection, and workflow execution. It depicts a system involving agents, LLM calls, and different workflow structures (sequential, parallel, reflection). The diagram is segmented into four main areas: A1 (Design Space Overview), A2 (Axis Definitions), B1-B3 (Topic Selection & Workflow), and C1-C3 (Workflow Structures & Tool Use).
### Components/Axes
* **A1: Design Space Overview:** Shows four flows (Flow 1, Flow 2, Flow 3, Flow 4) with varying numbers of subtasks and agents.
* **A2: Axis Definitions:** Defines the X-axis as "# subtask" and the Y-axis as "# agents". Includes a "D" label (likely representing data) and "RF" label (likely representing refinement).
* **B1: Topic Selector:** A box labeled "Topic Selector" with the description "proposes candidate story topics based on the given dataset". It branches into "Visualize Distribution" and "Visualize Correlation".
* **B2: Lead with Curiosity:** A box detailing the task description: "propose candidate story topics based on the given dataset". It shows agent roles: "Persona Scientist", "Persona Journalist", "Aggregation", "Selector". It also indicates "2 + 1 = 3 LLM calls".
* **B3: Subtask Visualization:** A series of bars representing "# subtask" with associated agent counts.
* **C1: Workflow Structures:** Illustrates "Sequential", "Parallel", and "Reflection" workflows.
* **C2: Workflow Details:** Shows the number of LLM calls for each workflow type (1 LLM call for Visualize Distribution and Correlation, 2 LLM calls for Insight Integration). Includes "Redundant" and "Supervision" elements.
* **C3: Tool Use:** Lists "Prompting" and "Data Retrieval" as tools.
### Detailed Analysis or Content Details
**A1: Design Space Overview**
* **Flow 1:** 2 subtasks, 1-2 agents. The visualization shows two distinct configurations: 2-1a and 2-1b.
* **Flow 2:** 2 subtasks, 2-2 agents.
* **Flow 3:** 3 subtasks, 3-1, 3-2, 3-2a, 3-2b, 3-2c agents.
* **Flow 4:** 4 subtasks, 4-1, 4-2 agents.
**A2: Axis Definitions**
* X-axis: "# subtask" - Scale is not explicitly defined, but ranges from 1 to 4.
* Y-axis: "# agents" - Scale is not explicitly defined, but ranges from 1 to 2.
**B2: Lead with Curiosity**
* Agent Roles:
* Persona Scientist: "more logical and scientific"
* Persona Journalist: "more emotion-evoking and engaging"
* Aggregation
* Selector: "Select a topic from two agents"
* LLM Calls: 2 + 1 = 3 LLM calls
**C2: Workflow Details**
* Visualize Distribution: Single Agent, 1 LLM call.
* Visualize Correlation: Single Agent, 1 LLM call.
* Insight Integration: 2 LLM calls.
* Redundant: A workflow involving multiple steps and feedback loops.
* Supervision: A workflow involving human oversight.
### Key Observations
* The diagram emphasizes the iterative nature of data storytelling, with workflows incorporating reflection and redundancy.
* The "Lead with Curiosity" section highlights the use of different personas to generate diverse story topics.
* The design space overview (A1) suggests a trade-off between the number of subtasks and the number of agents involved.
* The workflow structures (C1) demonstrate different approaches to processing information, ranging from sequential to parallel and reflective.
### Interpretation
The diagram presents a framework for automating the generation of data-driven visual stories. It suggests a system where a "Topic Selector" agent leverages LLMs to propose story ideas based on a given dataset. These ideas are then refined through workflows that can be structured sequentially, in parallel, or reflectively. The inclusion of "Redundant" and "Supervision" elements indicates a focus on ensuring the quality and accuracy of the generated stories. The design space overview (A1) implies that the optimal workflow configuration depends on the complexity of the task (number of subtasks) and the resources available (number of agents). The use of different personas ("Scientist" and "Journalist") suggests an attempt to balance analytical rigor with narrative appeal. The diagram highlights the potential of AI to assist in the creative process of data storytelling, while also acknowledging the importance of human oversight and refinement. The diagram is a high-level conceptual model, and lacks specific data or quantitative metrics beyond the number of LLM calls and the agent/subtask counts.