## Flowchart: Workflows for Generating Data-Driven Visual Storytelling
### Overview
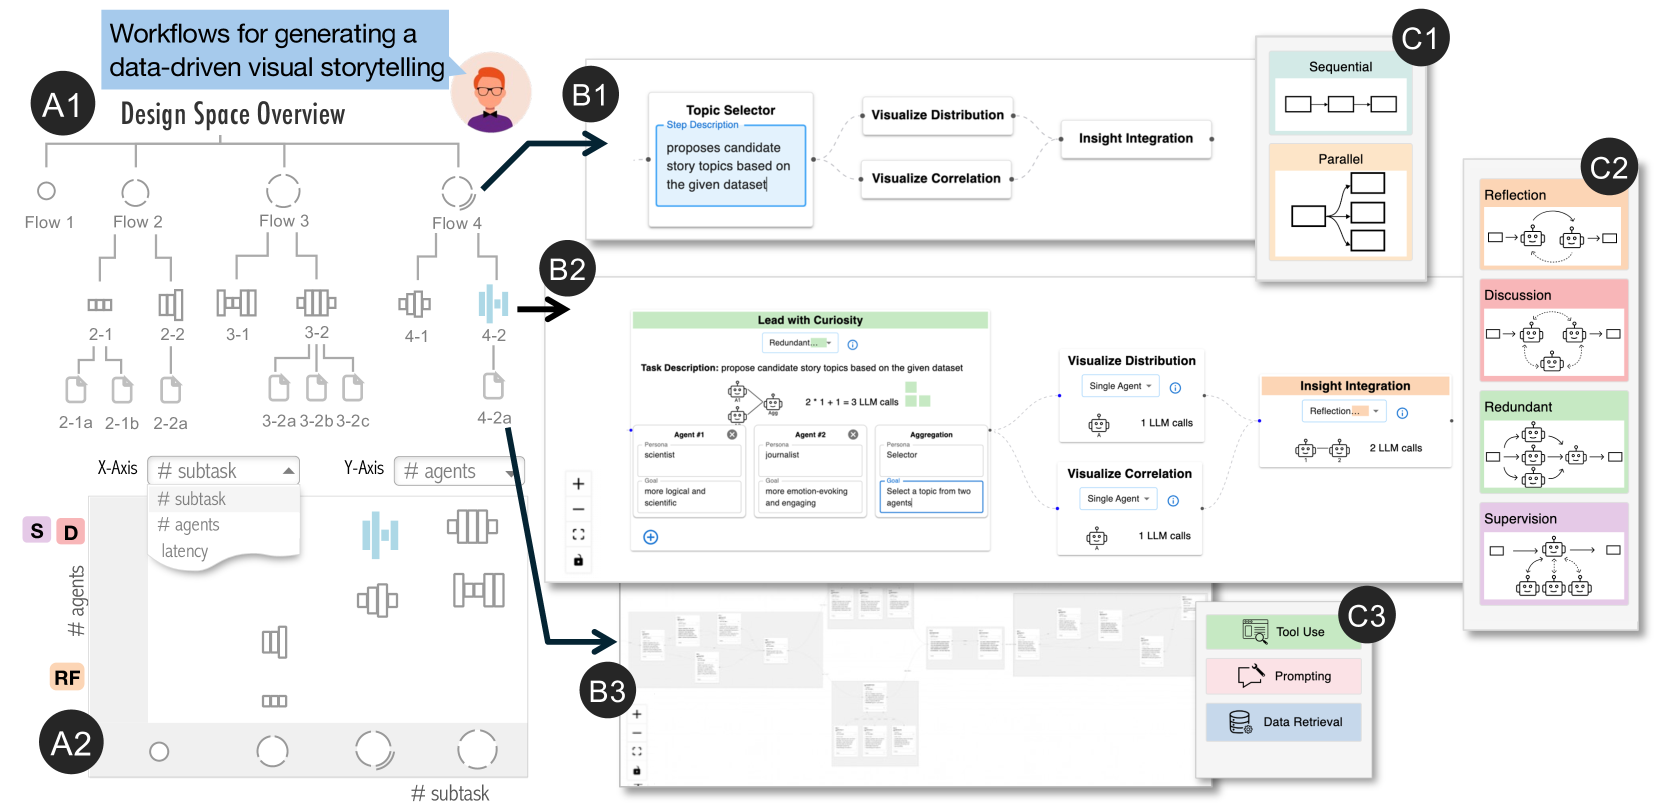
The diagram illustrates a multi-stage workflow for creating data-driven visual storytelling, divided into three primary components:
1. **Design Space Overview** (A1-A2): Explores configuration options for workflows
2. **Workflow Components** (B1-B3): Defines core processes and agent interactions
3. **Collaboration Patterns** (C1-C3): Shows agent coordination strategies
### Components/Axes
**A1: Design Space Overview**
- Flowchart with 4 main flows (Flow 1-4)
- Subflows labeled with numeric codes (e.g., 2-1a, 3-2b)
- X-axis: "# subtask" (dropdown menu)
- Y-axis: "# agents" (dropdown menu)
- Legend elements: S (purple), D (red), RF (orange)
**A2: Configuration Grid**
- X-axis: "# subtask" (dropdown)
- Y-axis: "# agents" (dropdown)
- Grid cells show combinations of subtasks/agents
- Latency indicator present
**B1: Topic Selector**
- Proposes candidate story topics based on dataset
- Connects to Visualize Distribution and Insight Integration
**B2: Lead with Curiosity**
- Task: Propose candidate story topics
- Agent roles: Scientist (logical/scientific), Journalist (emotion-evoking)
- Aggregation: Select topic from two agents
**B3: Visualization Interface**
- Shows multiple visualization panels
- Includes data points and connection lines
**C1: Collaboration Patterns**
- Sequential: Linear workflow (□→□→□)
- Parallel: Branching workflow (□→□→□)
**C2: Reflection/Discussion**
- Reflection: Single agent self-feedback (□↔□)
- Discussion: Multi-agent dialogue (□↔□↔□)
**C3: Tool Use**
- Tool Use: Visualization tools (📊)
- Prompting: Text generation (💬)
- Data Retrieval: Database access (💾)
### Detailed Analysis
**A1 Flow Details**
- Flow 1: 2-1a, 2-1b, 2-2a
- Flow 2: 2-2
- Flow 3: 3-1, 3-2, 3-3, 3-2b, 3-2c
- Flow 4: 4-1, 4-2, 4-2a
**A2 Grid Observations**
- Cells show varying combinations of subtasks/agents
- No numerical values visible in grid cells
- Latency indicator suggests performance considerations
**B2 Agent Configuration**
- Scientist agent: "more logical and scientific"
- Journalist agent: "more emotion-evoking and engaging"
- Aggregation requires selecting from two agents
**C1-C3 Pattern Details**
- Sequential: 3-step linear process
- Parallel: 3-branch concurrent process
- Reflection: 2-agent self-feedback loop
- Discussion: 3-agent dialogue network
- Redundant: 4-agent verification chain
- Supervision: 3-agent oversight structure
### Key Observations
1. **Iterative Design**: Multiple flow variations suggest emphasis on adaptability
2. **Agent Specialization**: Distinct roles for different cognitive strengths
3. **Collaboration Complexity**: Ranges from simple (2-agent) to complex (4-agent) interactions
4. **Visualization Integration**: Multiple visualization types connected to data sources
5. **Redundancy Mechanisms**: Built-in verification through multiple agent perspectives
### Interpretation
This workflow diagram demonstrates a sophisticated approach to data-driven storytelling that:
- Balances exploration (multiple flow options) with structured execution
- Leverages specialized agent capabilities for different storytelling aspects
- Implements multi-layered collaboration patterns to enhance output quality
- Incorporates iterative refinement through reflection and discussion
- Uses visualization as both output and intermediate processing step
The configuration grid (A2) suggests that optimal results may depend on finding the right balance between subtask complexity and agent count, though specific performance metrics aren't provided. The collaboration patterns indicate a progression from basic to advanced coordination methods, implying scalability for different project needs.