## Diagram: Model Verification Process
### Overview
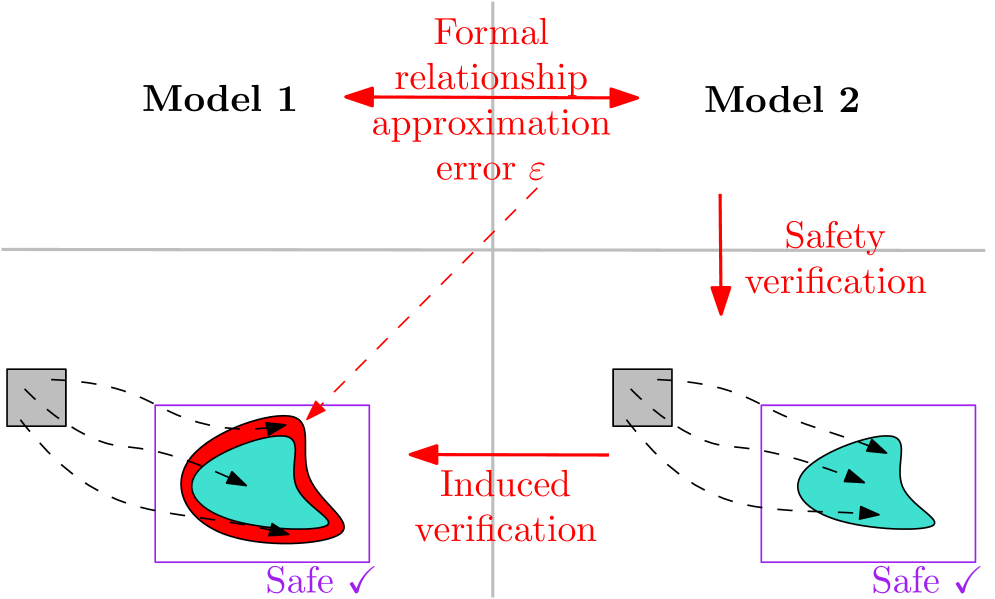
The image illustrates a model verification process involving two models, Model 1 and Model 2, and their formal relationship. It shows how safety verification is performed on Model 2 and how this verification is induced back to Model 1. The diagram includes visual representations of state spaces and their relationships.
### Components/Axes
* **Models:** Model 1 (left) and Model 2 (right)
* **Formal Relationship:** A bidirectional arrow labeled "Formal relationship approximation error ε" indicates the relationship between the two models.
* **Safety Verification:** A downward arrow labeled "Safety verification" points from Model 2 to its state space.
* **Induced Verification:** An arrow labeled "Induced verification" points from Model 2's state space back to Model 1's state space.
* **State Spaces:** Each model has an associated state space represented by a purple square. Inside each square is a cyan-filled shape representing the safe region. Model 1's safe region has a red boundary.
* **Initial States:** Each model has an initial state represented by a gray square with a diagonal line. Dashed lines connect the initial states to the state spaces.
* **Safety Labels:** Each state space is labeled "Safe" with a checkmark.
### Detailed Analysis
* **Model 1 (Left):**
* Initial state: A gray square located above and to the left of the state space.
* State space: A purple square containing a cyan-filled shape with a red boundary. Arrows within the cyan shape indicate state transitions.
* Label: "Safe" with a checkmark below the purple square.
* **Model 2 (Right):**
* Initial state: A gray square located above and to the left of the state space.
* State space: A purple square containing a cyan-filled shape. Arrows within the cyan shape indicate state transitions.
* Label: "Safe" with a checkmark below the purple square.
* **Arrows:**
* "Formal relationship approximation error ε": A red, bidirectional arrow connecting Model 1 and Model 2.
* "Safety verification": A red, downward arrow pointing from Model 2 to its state space.
* "Induced verification": A red arrow pointing from Model 2's state space to Model 1's state space.
* **Dashed Line:** A red dashed line connects the "Formal relationship approximation error ε" arrow to the "Induced verification" arrow.
### Key Observations
* The diagram emphasizes the relationship between two models and how safety verification performed on one model can be used to infer safety in the other.
* The red boundary around the safe region in Model 1's state space suggests a potential difference or additional constraint compared to Model 2.
* The dashed line connecting the formal relationship to the induced verification suggests that the formal relationship is used to induce the verification.
### Interpretation
The diagram illustrates a process where safety verification is performed on a simplified or abstracted model (Model 2) and then "induced" back to a more complex model (Model 1). The "Formal relationship approximation error ε" represents the mathematical relationship and the error introduced by the abstraction. The "Induced verification" step leverages this relationship to infer safety properties in Model 1 based on the verification results from Model 2. The red boundary around the safe region in Model 1 might indicate that Model 1 has additional safety constraints or a more complex safety definition than Model 2. The diagram suggests a method for verifying complex systems by verifying simpler abstractions and then transferring the results.