## Line Charts: Performance Comparison of Llama Models
### Overview
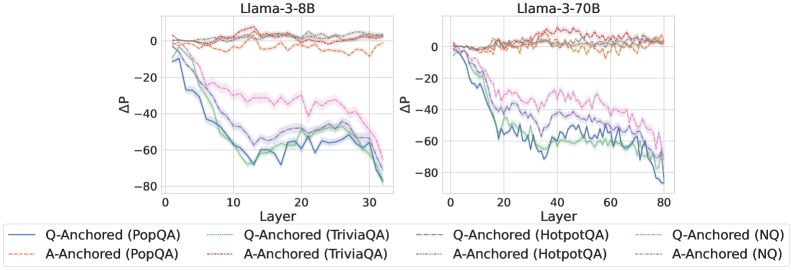
The image presents two line charts comparing the performance of Llama models (Llama-3-8B and Llama-3-70B) across different layers. The y-axis represents ΔP (change in performance), and the x-axis represents the layer number. Each chart displays multiple data series, distinguished by line style and color, representing different question-answering datasets and anchoring methods (Q-Anchored and A-Anchored).
### Components/Axes
* **Titles:**
* Left Chart: "Llama-3-8B"
* Right Chart: "Llama-3-70B"
* **X-Axis:**
* Label: "Layer"
* Left Chart: Scale ranges from 0 to 30, with tick marks at approximately 0, 10, 20, and 30.
* Right Chart: Scale ranges from 0 to 80, with tick marks at approximately 0, 20, 40, 60, and 80.
* **Y-Axis:**
* Label: "ΔP"
* Scale ranges from -80 to 0, with tick marks at -80, -60, -40, -20, and 0.
* **Legend:** Located at the bottom of the image.
* Q-Anchored (PopQA): Solid blue line
* A-Anchored (PopQA): Dashed brown line
* Q-Anchored (TriviaQA): Dotted green line
* A-Anchored (TriviaQA): Dash-dot brown line
* Q-Anchored (HotpotQA): Dash-dot-dot red line
* A-Anchored (HotpotQA): Dotted brown line
* Q-Anchored (NQ): Dotted pink line
* A-Anchored (NQ): Dotted gray line
### Detailed Analysis
**Left Chart (Llama-3-8B):**
* **Q-Anchored (PopQA):** (Solid blue line) Starts near 0 and decreases to approximately -75 by layer 30.
* **A-Anchored (PopQA):** (Dashed brown line) Remains relatively stable around 0 throughout all layers.
* **Q-Anchored (TriviaQA):** (Dotted green line) Starts near 0 and decreases to approximately -65 by layer 30.
* **A-Anchored (TriviaQA):** (Dash-dot brown line) Remains relatively stable around 0 throughout all layers.
* **Q-Anchored (HotpotQA):** (Dash-dot-dot red line) Remains relatively stable around 0 throughout all layers.
* **A-Anchored (HotpotQA):** (Dotted brown line) Remains relatively stable around 0 throughout all layers.
* **Q-Anchored (NQ):** (Dotted pink line) Starts near 0 and decreases to approximately -30 by layer 30.
* **A-Anchored (NQ):** (Dotted gray line) Remains relatively stable around 0 throughout all layers.
**Right Chart (Llama-3-70B):**
* **Q-Anchored (PopQA):** (Solid blue line) Starts near 0 and decreases to approximately -80 by layer 80.
* **A-Anchored (PopQA):** (Dashed brown line) Remains relatively stable around 0 throughout all layers.
* **Q-Anchored (TriviaQA):** (Dotted green line) Starts near 0 and decreases to approximately -70 by layer 80.
* **A-Anchored (TriviaQA):** (Dash-dot brown line) Remains relatively stable around 0 throughout all layers.
* **Q-Anchored (HotpotQA):** (Dash-dot-dot red line) Remains relatively stable around 0 throughout all layers.
* **A-Anchored (HotpotQA):** (Dotted brown line) Remains relatively stable around 0 throughout all layers.
* **Q-Anchored (NQ):** (Dotted pink line) Starts near 0 and decreases to approximately -30 by layer 80.
* **A-Anchored (NQ):** (Dotted gray line) Remains relatively stable around 0 throughout all layers.
### Key Observations
* The "Q-Anchored" series (PopQA, TriviaQA, and NQ) show a significant decrease in ΔP as the layer number increases for both Llama models.
* The "A-Anchored" series (PopQA, TriviaQA, HotpotQA, and NQ) remain relatively stable around 0 across all layers for both Llama models.
* The Llama-3-70B model has a larger layer range (0-80) compared to the Llama-3-8B model (0-30).
* The Q-Anchored (HotpotQA) series remains stable around 0 for both models.
### Interpretation
The data suggests that anchoring the question (Q-Anchored) leads to a decrease in performance (ΔP) as the model processes deeper layers, particularly for the PopQA, TriviaQA, and NQ datasets. This could indicate that the model's ability to answer questions from these datasets degrades with increasing layer depth when the question is anchored. Conversely, anchoring the answer (A-Anchored) results in stable performance across all layers, suggesting that the model maintains its ability to answer questions when the answer is anchored. The HotpotQA dataset shows stable performance regardless of whether the question or answer is anchored. The difference in layer range between the two models (8B vs 70B) highlights the larger processing capacity of the 70B model.