\n
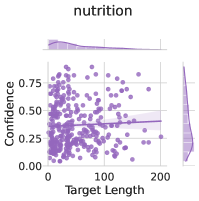
## Scatter Plot: Nutrition Confidence vs. Target Length
### Overview
The image presents a scatter plot visualizing the relationship between "Target Length" and "Confidence" related to "nutrition". The plot includes a regression line with a shaded confidence interval, and a large number of individual data points.
### Components/Axes
* **Title:** "nutrition" (positioned at the top-center)
* **X-axis:** "Target Length" (ranging from approximately 0 to 220, with markers at 0, 100, and 200)
* **Y-axis:** "Confidence" (ranging from 0.00 to 0.75, with markers at 0.00, 0.25, 0.50, and 0.75)
* **Data Points:** Numerous purple circles representing individual data observations.
* **Regression Line:** A purple line representing the trend of the data. It appears to be approximately flat.
* **Confidence Interval:** A shaded purple area around the regression line, indicating the uncertainty in the estimated trend.
### Detailed Analysis
The scatter plot shows a wide dispersion of data points. The trend line is nearly horizontal, suggesting a weak or non-existent linear relationship between Target Length and Confidence.
* **Data Point Distribution:**
* A dense cluster of points exists near Target Length = 0, with Confidence values ranging from approximately 0.1 to 0.7.
* As Target Length increases, the points become more scattered, with a general tendency for Confidence to remain between 0.2 and 0.5.
* There is a sparse distribution of points at higher Target Length values (above 150), with Confidence values generally below 0.4.
* **Regression Line:** The regression line is approximately horizontal, with a y-intercept around 0.35 and a very small slope.
* **Confidence Interval:** The confidence interval is relatively wide, indicating substantial uncertainty in the estimated regression line. The interval is wider at the higher Target Length values.
### Key Observations
* The relationship between Target Length and Confidence appears to be weak.
* There is a large amount of variability in Confidence for a given Target Length.
* The confidence interval is wide, suggesting that the estimated trend is not very precise.
* There are no obvious outliers.
### Interpretation
The data suggests that the length of the target (whatever that refers to in the context of "nutrition") has little predictive power regarding the confidence level. The confidence level appears to be largely independent of the target length. The wide confidence interval indicates that other factors likely play a more significant role in determining confidence. The flat regression line suggests that, on average, confidence does not change significantly with target length. The data could be indicative of a noisy system where the target length is not a strong signal for the confidence metric. Further investigation would be needed to understand the underlying reasons for this lack of correlation and the source of the variability.