\n
## Chart: Synthetic Problems Difficulty for SwS Models
### Overview
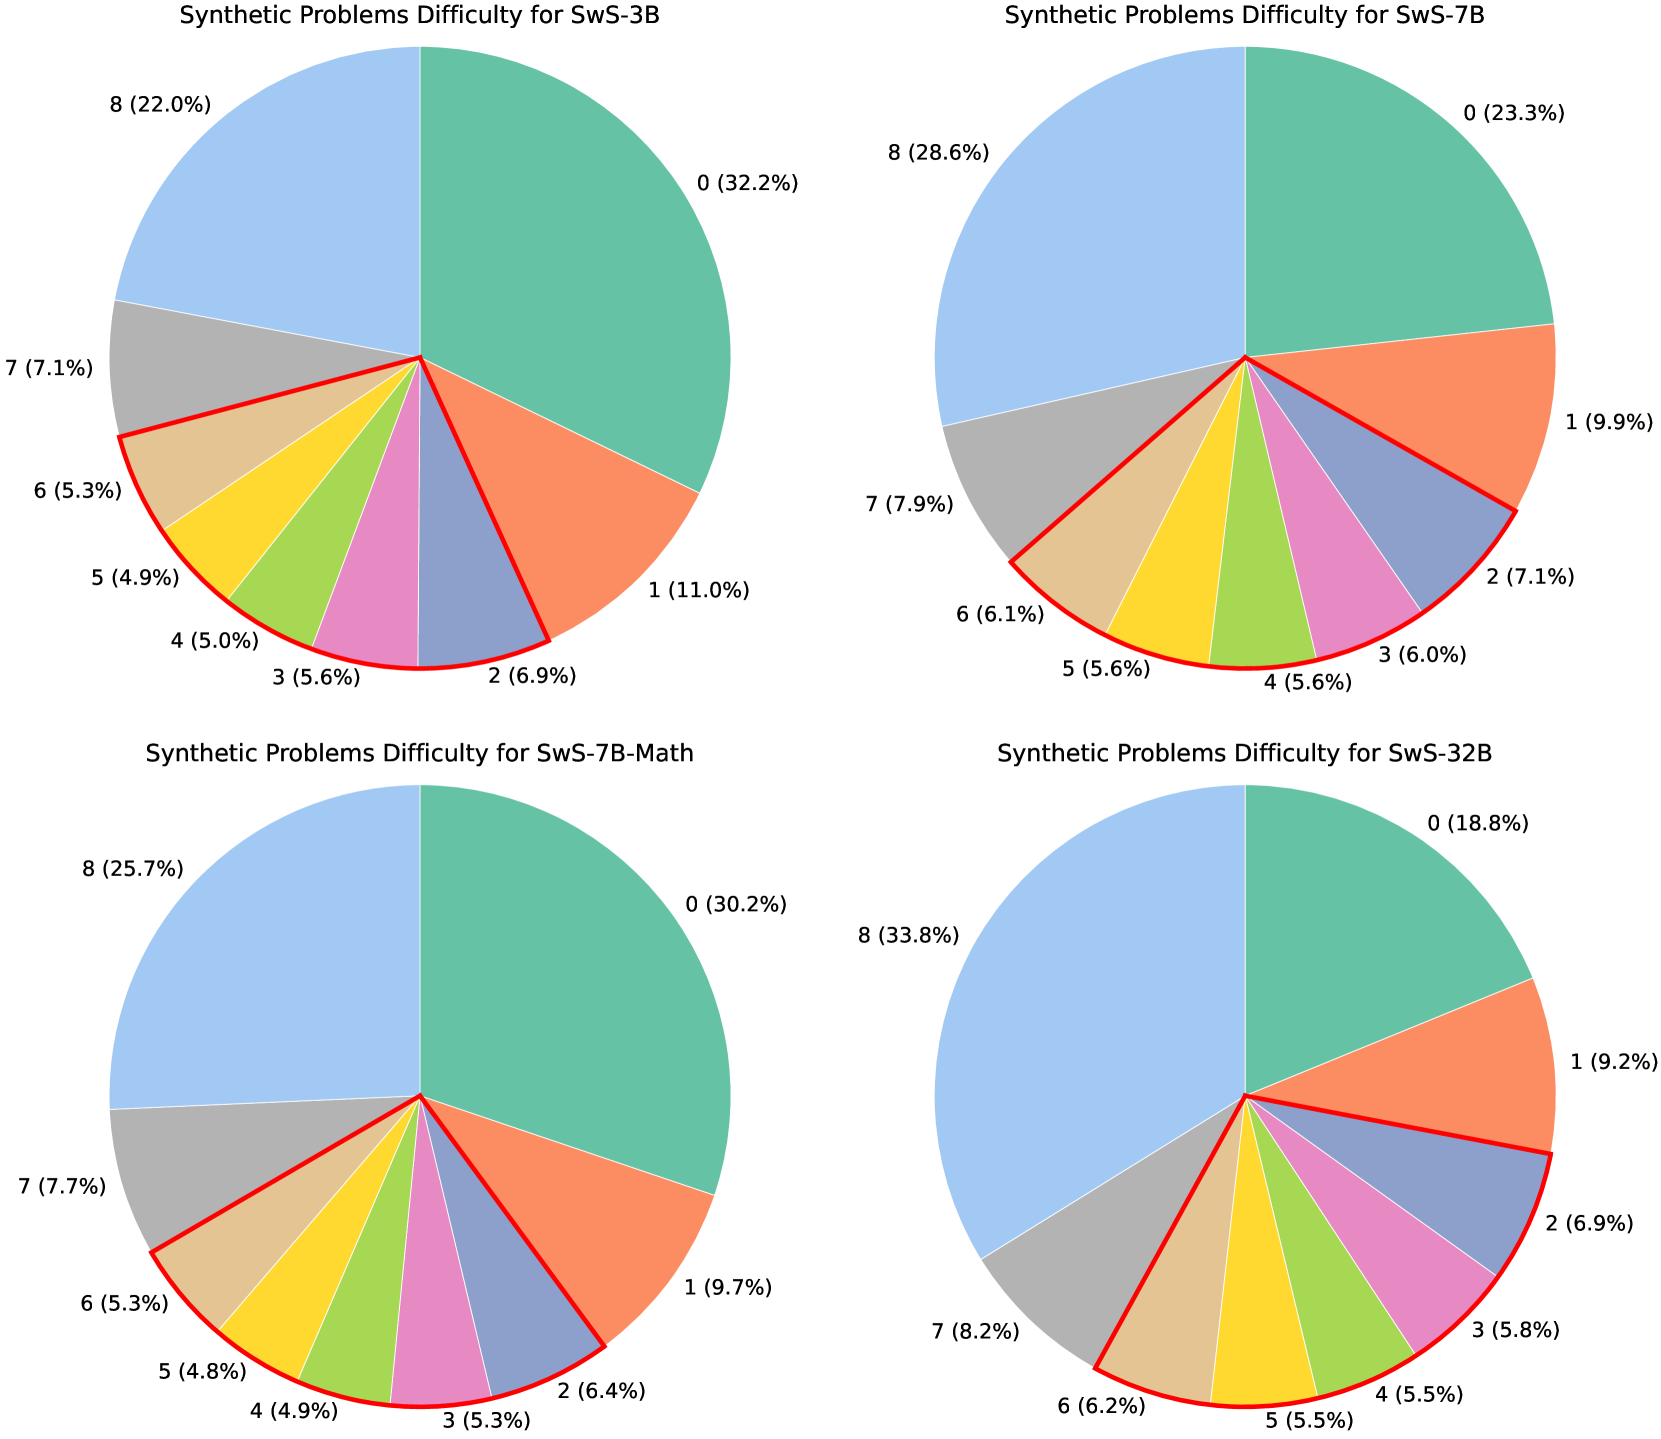
The image presents four pie charts, each representing the distribution of difficulty levels for synthetic problems solved by different SwS (likely Solver-based Systems) models: SwS-3B, SwS-7B, SwS-7B-Math, and SwS-32B. Each pie chart shows the percentage of problems falling into difficulty levels ranging from 0 to 8.
### Components/Axes
Each chart has a title indicating the SwS model being analyzed. The pie slices are labeled with the difficulty level (0-8) and the corresponding percentage of problems at that level. There are no explicit axes, as it's a pie chart representation.
### Detailed Analysis or Content Details
**1. SwS-3B:**
* Difficulty 0: 32.2% (Dark Blue)
* Difficulty 1: 11.0% (Light Blue)
* Difficulty 2: 6.9% (Yellow)
* Difficulty 3: 5.6% (Orange)
* Difficulty 4: 5.0% (Red)
* Difficulty 5: 4.9% (Pink)
* Difficulty 6: 5.3% (Purple)
* Difficulty 7: 7.1% (Brown)
* Difficulty 8: 22.0% (Green)
**2. SwS-7B:**
* Difficulty 0: 23.3% (Dark Blue)
* Difficulty 1: 9.9% (Light Blue)
* Difficulty 2: 7.1% (Yellow)
* Difficulty 3: 6.0% (Orange)
* Difficulty 4: 5.6% (Red)
* Difficulty 5: 6.1% (Pink)
* Difficulty 6: 6.1% (Purple)
* Difficulty 7: 7.9% (Brown)
* Difficulty 8: 28.6% (Green)
**3. SwS-7B-Math:**
* Difficulty 0: 30.2% (Dark Blue)
* Difficulty 1: 9.7% (Light Blue)
* Difficulty 2: 6.4% (Yellow)
* Difficulty 3: 5.3% (Orange)
* Difficulty 4: 4.9% (Red)
* Difficulty 5: 4.8% (Pink)
* Difficulty 6: 5.3% (Purple)
* Difficulty 7: 7.7% (Brown)
* Difficulty 8: 25.7% (Green)
**4. SwS-32B:**
* Difficulty 0: 18.8% (Dark Blue)
* Difficulty 1: 9.2% (Light Blue)
* Difficulty 2: 6.9% (Yellow)
* Difficulty 3: 5.8% (Orange)
* Difficulty 4: 5.5% (Red)
* Difficulty 5: 5.4% (Pink)
* Difficulty 6: 6.2% (Purple)
* Difficulty 7: 8.2% (Brown)
* Difficulty 8: 33.8% (Green)
### Key Observations
* Difficulty level 0 consistently represents the largest proportion of problems across all models, ranging from 18.8% (SwS-32B) to 32.2% (SwS-3B).
* Difficulty level 8 is the second most frequent for SwS-3B, SwS-7B, and SwS-32B, while for SwS-7B-Math it is also the second most frequent.
* The distribution of difficulty levels appears relatively similar across all four models, with a concentration in the lower difficulty levels (0-4).
* SwS-32B has the highest percentage of problems at difficulty level 8 (33.8%), suggesting it may be able to handle more complex problems compared to the other models.
### Interpretation
The data suggests that the synthetic problems used to evaluate these SwS models are generally easier, as the majority fall into the lower difficulty levels. The slight variations in distribution across the models might indicate differences in their capabilities, with SwS-32B showing a greater ability to tackle more challenging problems (as evidenced by the higher percentage at difficulty level 8). The relatively consistent distribution across the models suggests that the problem generation process is similar for all, and the models are responding in a comparable manner. The fact that no model excels significantly in solving high-difficulty problems could indicate a limitation in the problem generation process or the models' inherent capabilities. Further investigation would be needed to determine the specific types of problems that fall into the higher difficulty levels and whether the models struggle with specific problem characteristics.