## Pie Charts: Synthetic Problems Difficulty Distribution for Four Models
### Overview
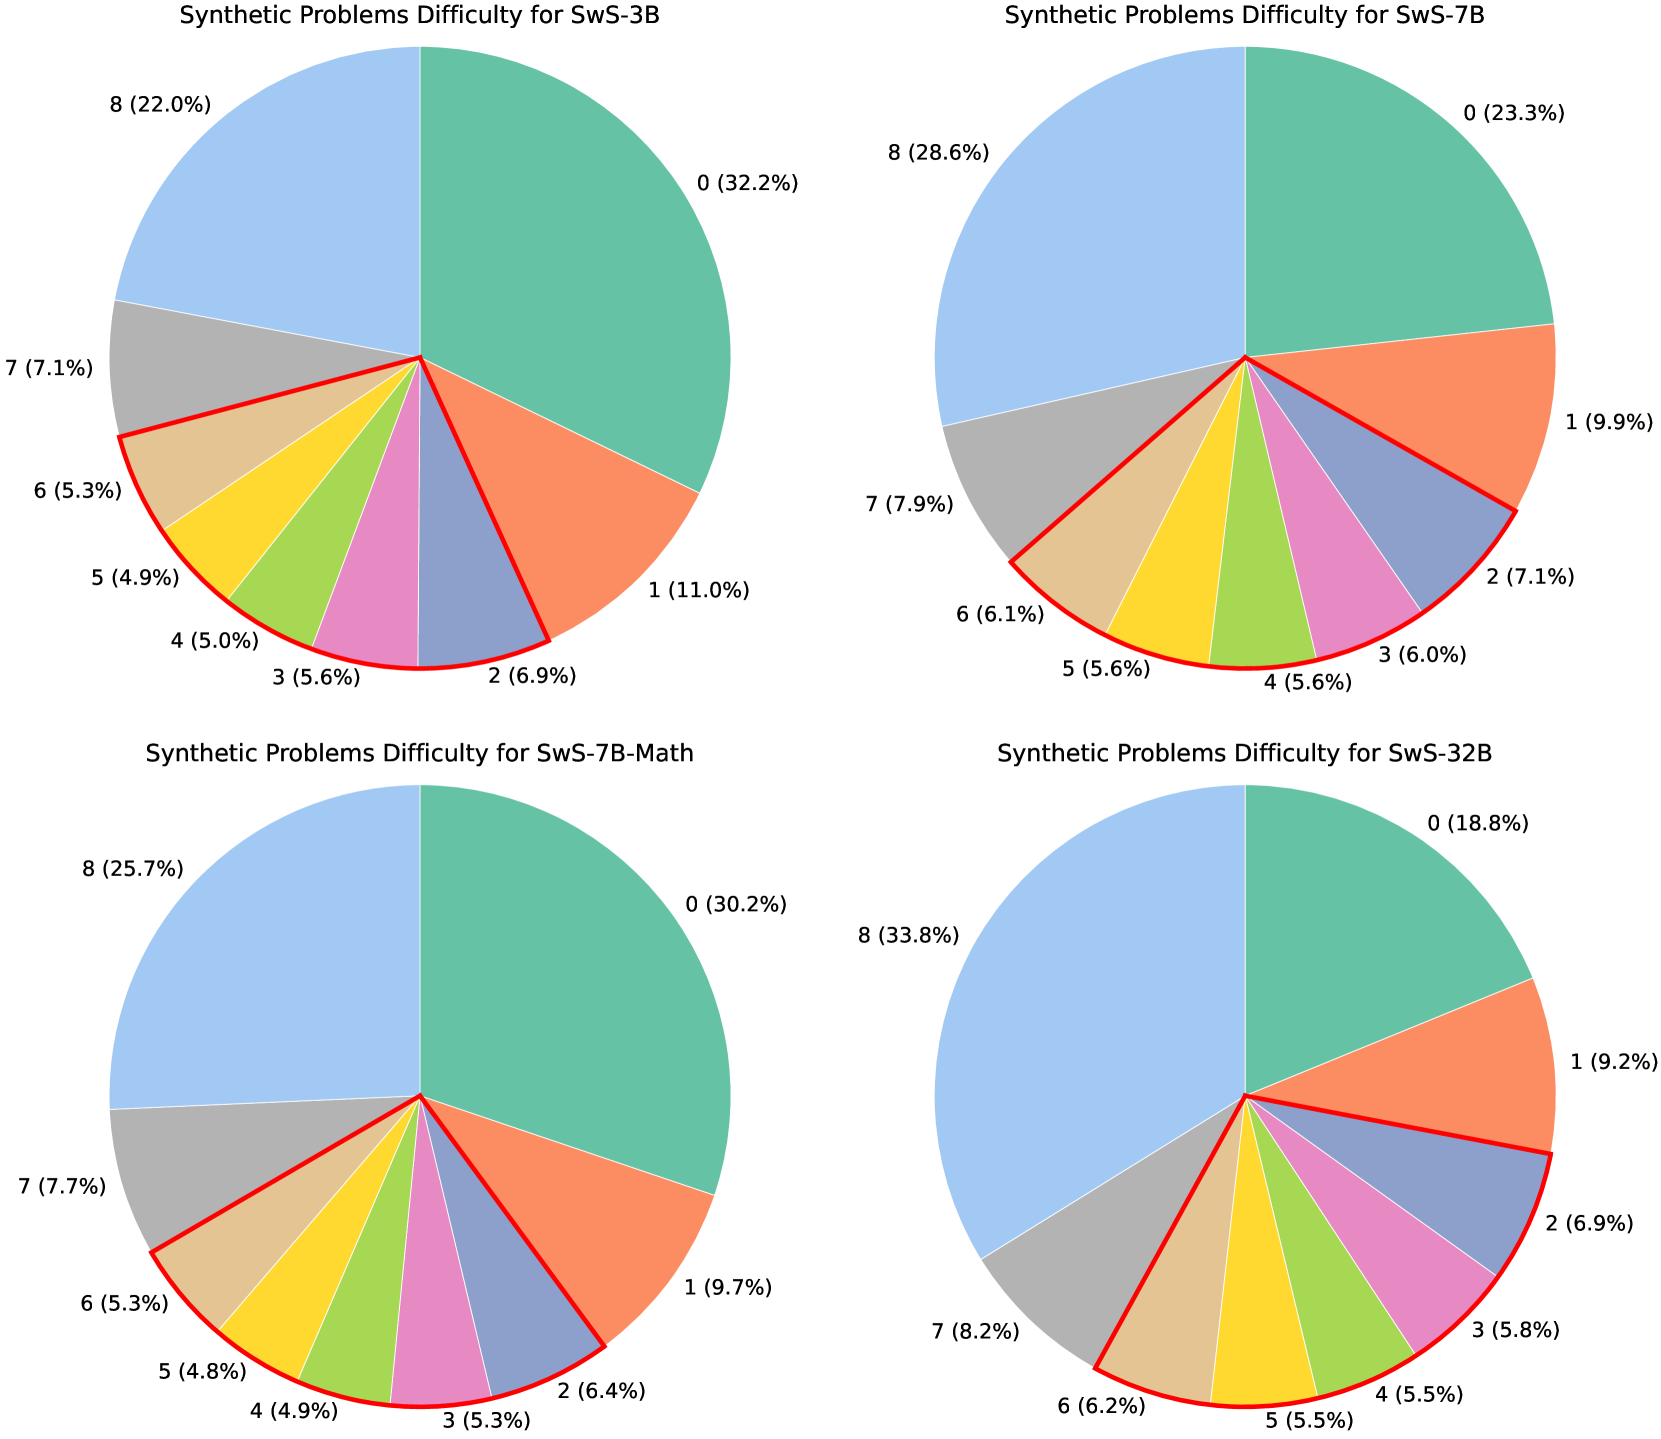
The image displays four pie charts arranged in a 2x2 grid. Each chart visualizes the distribution of synthetic problem difficulty levels (labeled 0 through 8) for a different AI model variant. The charts share a consistent color scheme for the difficulty levels. The overall title for each chart is "Synthetic Problems Difficulty for [Model Name]".
### Components/Axes
* **Chart Titles (Top of each pie):**
* Top-Left: `Synthetic Problems Difficulty for SwS-3B`
* Top-Right: `Synthetic Problems Difficulty for SwS-7B`
* Bottom-Left: `Synthetic Problems Difficulty for SwS-7B-Math`
* Bottom-Right: `Synthetic Problems Difficulty for SwS-32B`
* **Data Series (Difficulty Levels):** Each pie is segmented into 9 categories, labeled 0 to 8. The color mapping is consistent across all charts:
* Level 0: Teal/Green
* Level 1: Orange
* Level 2: Light Purple/Blue
* Level 3: Pink
* Level 4: Light Green
* Level 5: Yellow
* Level 6: Tan/Beige
* Level 7: Grey
* Level 8: Light Blue
* **Labels:** Each segment is directly labeled with its difficulty level number and its percentage of the total, formatted as `[Level] ([Percentage]%)`.
### Detailed Analysis
**1. SwS-3B (Top-Left Chart)**
* **Trend:** The distribution is heavily skewed towards the lowest (0) and highest (8) difficulty levels, forming a bimodal shape.
* **Data Points (Clockwise from top):**
| Level | Percentage |
| :---- | :--------- |
| 0 | 32.2% |
| 1 | 11.0% |
| 2 | 6.9% |
| 3 | 5.6% |
| 4 | 5.0% |
| 5 | 4.9% |
| 6 | 5.3% |
| 7 | 7.1% |
| 8 | 22.0% |
**2. SwS-7B (Top-Right Chart)**
* **Trend:** The distribution remains bimodal but becomes more balanced between the extremes compared to SwS-3B. The proportion of the highest difficulty (8) increases notably.
* **Data Points (Clockwise from top):**
| Level | Percentage |
| :---- | :--------- |
| 0 | 23.3% |
| 1 | 9.9% |
| 2 | 7.1% |
| 3 | 6.0% |
| 4 | 5.6% |
| 5 | 5.6% |
| 6 | 6.1% |
| 7 | 7.9% |
| 8 | 28.6% |
**3. SwS-7B-Math (Bottom-Left Chart)**
* **Trend:** This distribution closely mirrors that of SwS-3B, with a strong peak at Level 0 and a secondary peak at Level 8. The middle-difficulty segments (1-7) are relatively small and uniform.
* **Data Points (Clockwise from top):**
| Level | Percentage |
| :---- | :--------- |
| 0 | 30.2% |
| 1 | 9.7% |
| 2 | 6.4% |
| 3 | 5.3% |
| 4 | 4.9% |
| 5 | 4.8% |
| 6 | 5.3% |
| 7 | 7.7% |
| 8 | 25.7% |
**4. SwS-32B (Bottom-Right Chart)**
* **Trend:** This chart shows the most significant shift. The proportion of the highest difficulty level (8) becomes dominant, while the lowest difficulty (0) shrinks considerably. The distribution is less bimodal and more skewed toward higher difficulties.
* **Data Points (Clockwise from top):**
| Level | Percentage |
| :---- | :--------- |
| 0 | 18.8% |
| 1 | 9.2% |
| 2 | 6.9% |
| 3 | 5.8% |
| 4 | 5.5% |
| 5 | 5.5% |
| 6 | 6.2% |
| 7 | 8.2% |
| 8 | 33.8% |
### Key Observations
1. **Bimodal Dominance:** All four models exhibit a bimodal distribution, with the vast majority of problems falling into either the easiest (Level 0) or hardest (Level 8) categories. The middle difficulties (1-7) consistently represent a much smaller portion of the total.
2. **Model Size Correlation:** As the model size increases from SwS-3B to SwS-32B, there is a clear trend: the percentage of the hardest problems (Level 8) increases (22.0% -> 28.6% -> 25.7% -> 33.8%), while the percentage of the easiest problems (Level 0) generally decreases (32.2% -> 23.3% -> 30.2% -> 18.8%).
3. **SwS-7B-Math Anomaly:** The SwS-7B-Math model's distribution is more similar to the smaller SwS-3B than to its similarly-sized SwS-7B counterpart. This suggests the math-focused fine-tuning may have altered the problem difficulty profile.
4. **SwS-32B Shift:** The largest model (SwS-32B) shows the most pronounced shift toward higher difficulty, with Level 8 comprising over a third of all problems.
### Interpretation
The data suggests a strong relationship between model scale/capability and the difficulty of synthetic problems it is evaluated on or generates. The consistent bimodal pattern indicates that the synthetic problem generation process tends to create tasks that are either very straightforward or highly challenging, with fewer intermediate problems.
The key insight is that **larger or more specialized models (like SwS-32B and SwS-7B) are associated with a higher proportion of difficult (Level 8) problems.** This could imply one of two things:
1. **Evaluation Bias:** The benchmark or generation method is designed to scale problem difficulty with model size, ensuring larger models are tested on harder tasks.
2. **Model Capability:** Larger models are either capable of solving harder problems (thus being evaluated on them) or are generating more complex synthetic problems themselves.
The outlier, SwS-7B-Math, demonstrates that domain-specific tuning (mathematics) can significantly alter the difficulty profile, making it more similar to a smaller base model in this specific metric. This highlights that model size is not the sole determinant of the problem difficulty distribution; training objective plays a crucial role.
In summary, the charts reveal a deliberate or emergent scaling of problem difficulty with model size, characterized by a persistent focus on the extremes of the difficulty spectrum.