\n
## Scatter Plots: Method Score vs. Human Score for Different Self-Check Methods
### Overview
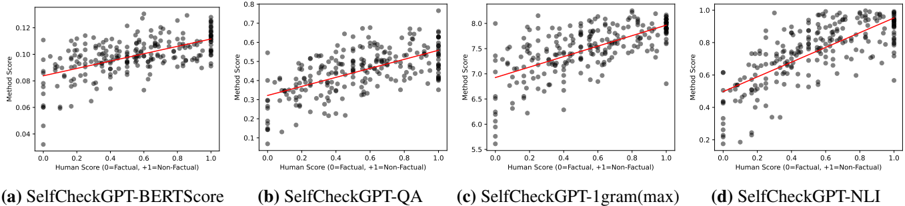
The image presents four scatter plots, each comparing "Method Score" against "Human Score". Each plot represents a different self-checking method: SelfCheck-BERTScore, SelfCheckGPT-QA, SelfCheck-1gram(max), and SelfCheckGPT-NLI. A red line represents a linear regression fit to the data in each plot.
### Components/Axes
Each plot shares the following components:
* **X-axis:** Labeled "Human Score (0=Factual, +1=Non-Factual)". The scale ranges from approximately 0.0 to 1.0.
* **Y-axis:** Labeled "Method Score". The scale varies between plots:
* (a) ranges from approximately 0.04 to 0.12
* (b) ranges from approximately 0.10 to 0.65
* (c) ranges from approximately 5.5 to 8.0
* (d) ranges from approximately 0.2 to 1.0
* **Data Points:** Represented by gray dots.
* **Regression Line:** A red line indicating the linear relationship between the two scores.
* **Labels:** Each plot is labeled with a letter (a, b, c, d) and the name of the corresponding method.
### Detailed Analysis or Content Details
**Plot (a): SelfCheck-BERTScore**
* The data points are scattered, showing a generally positive correlation.
* The regression line slopes upward, indicating that as the Human Score increases, the Method Score tends to increase.
* Approximate data points (visually estimated):
* Human Score = 0.2, Method Score ≈ 0.06
* Human Score = 0.4, Method Score ≈ 0.08
* Human Score = 0.6, Method Score ≈ 0.09
* Human Score = 0.8, Method Score ≈ 0.10
* Human Score = 1.0, Method Score ≈ 0.12
**Plot (b): SelfCheckGPT-QA**
* The data points are more densely clustered than in plot (a), also showing a positive correlation.
* The regression line is steeper than in plot (a), suggesting a stronger relationship.
* Approximate data points:
* Human Score = 0.2, Method Score ≈ 0.20
* Human Score = 0.4, Method Score ≈ 0.35
* Human Score = 0.6, Method Score ≈ 0.50
* Human Score = 0.8, Method Score ≈ 0.60
* Human Score = 1.0, Method Score ≈ 0.65
**Plot (c): SelfCheck-1gram(max)**
* The data points are scattered, but show a clear positive correlation.
* The regression line is relatively steep.
* Approximate data points:
* Human Score = 0.2, Method Score ≈ 6.0
* Human Score = 0.4, Method Score ≈ 6.7
* Human Score = 0.6, Method Score ≈ 7.3
* Human Score = 0.8, Method Score ≈ 7.7
* Human Score = 1.0, Method Score ≈ 8.0
**Plot (d): SelfCheckGPT-NLI**
* The data points are scattered, showing a positive correlation.
* The regression line is moderately steep.
* Approximate data points:
* Human Score = 0.2, Method Score ≈ 0.30
* Human Score = 0.4, Method Score ≈ 0.50
* Human Score = 0.6, Method Score ≈ 0.70
* Human Score = 0.8, Method Score ≈ 0.85
* Human Score = 1.0, Method Score ≈ 0.95
### Key Observations
* All four methods demonstrate a positive correlation between Human Score and Method Score.
* The strength of the correlation appears to vary between methods, with SelfCheck-1gram(max) and SelfCheckGPT-NLI showing a stronger relationship than SelfCheck-BERTScore.
* The scales of the Y-axis (Method Score) differ significantly between the plots, making direct comparison of the absolute Method Score values difficult.
### Interpretation
The plots suggest that all four self-checking methods are capable of identifying factual inaccuracies to some extent, as indicated by the positive correlation with human judgment. However, the varying scales and scatter suggest that the methods have different sensitivities and levels of agreement with human assessment. The steeper regression lines in plots (b), (c), and (d) indicate that these methods are more strongly aligned with human scores. The differences in the scales of the Method Score suggest that the methods measure "factuality" or "accuracy" in different ways or on different scales. The scatter in the data points indicates that none of the methods are perfect predictors of human judgment, and there is considerable variability in their performance. Further analysis would be needed to determine which method is most reliable and appropriate for a given application.