## Scatter Plots: Correlation Between Human and Method Scores
### Overview
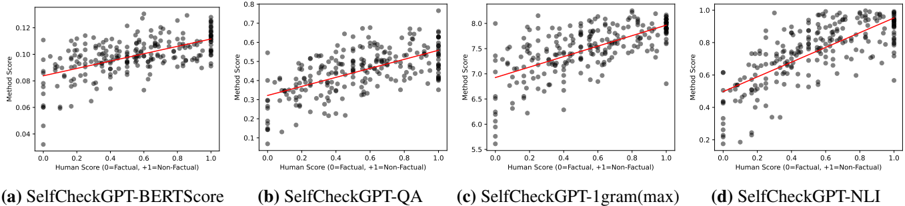
The image contains four scatter plots comparing human scores (x-axis) to method scores (y-axis) for different evaluation methods. Each plot includes a red trend line indicating the general correlation between human and method assessments. The methods evaluated are:
- (a) SelfCheckGPT-BERTScore
- (b) SelfCheckGPT-QA
- (c) SelfCheckGPT-1gram(max)
- (d) SelfCheckGPT-NLI
### Components/Axes
- **X-axis**: "Human Score (0=Factual, +1=Non-Factual)"
- Scale: 0.0 to 1.0 (linear)
- **Y-axis**: "Method Score"
- Scales vary per plot:
- (a): 0.04–0.12
- (b): 0.1–0.7
- (c): 5.5–8.0
- (d): 0.2–1.0
- **Data Points**: Black dots representing individual data points.
- **Trend Line**: Red line showing the linear regression fit for each method.
### Detailed Analysis
#### (a) SelfCheckGPT-BERTScore
- **Trend**: Positive slope (0.08–0.12 y-axis range).
- **Cluster**: Data points are moderately spread but follow the trend line closely.
- **Outliers**: A few points deviate slightly above the trend line.
#### (b) SelfCheckGPT-QA
- **Trend**: Positive slope (0.1–0.7 y-axis range).
- **Cluster**: Tighter clustering around the trend line compared to (a).
- **Outliers**: Minimal deviations; most points align with the trend.
#### (c) SelfCheckGPT-1gram(max)
- **Trend**: Strong positive slope (5.5–8.0 y-axis range).
- **Cluster**: High variability; points are widely dispersed but generally follow the trend.
- **Outliers**: One prominent outlier with a method score of ~8.0 and human score ~0.9.
#### (d) SelfCheckGPT-NLI
- **Trend**: Positive slope (0.2–1.0 y-axis range).
- **Cluster**: Tight clustering around the trend line, indicating high correlation.
- **Outliers**: No significant outliers; data points are densely packed.
### Key Observations
1. **Positive Correlation**: All methods show a positive relationship between human and method scores, suggesting alignment with human judgments.
2. **Scale Differences**:
- (c) uses a distinct scale (5.5–8.0), likely due to a different scoring mechanism (e.g., token-level evaluation).
- Other methods use normalized scores (0–1).
3. **Performance Variance**:
- (d) demonstrates the tightest correlation, implying higher reliability.
- (c) has the widest spread, suggesting lower consistency.
### Interpretation
The plots indicate that all evaluated methods generally agree with human assessments of factuality, but their reliability varies.
- **SelfCheckGPT-NLI (d)** performs best, with a near-perfect linear relationship and minimal noise.
- **SelfCheckGPT-1gram(max) (c)** shows the weakest correlation, possibly due to its reliance on n-gram statistics rather than contextual understanding.
- The outlier in (c) highlights cases where the method overestimates factuality despite low human scores, suggesting potential limitations in its evaluation logic.
The red trend lines confirm that higher human scores consistently correspond to higher method scores across all methods, validating their utility in assessing factuality. However, the scale and dispersion differences emphasize the need for method-specific calibration.