\n
## Line Chart: Two-Stage Code RL
### Overview
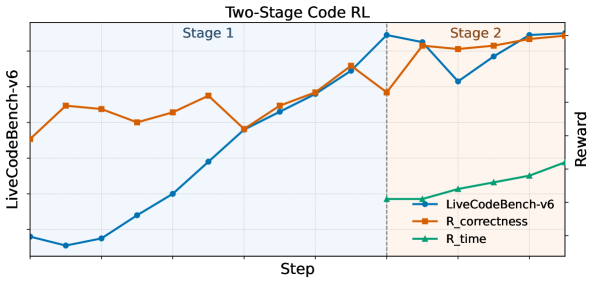
The image displays a line chart titled "Two-Stage Code RL," illustrating the performance of a reinforcement learning (RL) system for code generation over training steps. The chart is divided into two distinct phases, "Stage 1" and "Stage 2," separated by a vertical dashed line. It tracks three metrics: an overall benchmark score and two reward components.
### Components/Axes
* **Title:** "Two-Stage Code RL" (centered at the top).
* **X-Axis:** Labeled "Step" (bottom center). The axis has numerical markers, but specific values are not labeled. It represents the progression of training iterations.
* **Y-Axis (Left):** Labeled "LiveCodeBench-v6" (rotated vertically on the left). This axis corresponds to the blue line and represents the primary performance benchmark score.
* **Y-Axis (Right):** Labeled "Reward" (rotated vertically on the right). This axis corresponds to the orange and green lines, representing reward signals used during training.
* **Legend:** Located in the bottom-right corner of the chart area. It contains three entries:
* `LiveCodeBench-v6`: Blue line with circular markers.
* `R_correctness`: Orange line with square markers.
* `R_time`: Green line with triangular markers.
* **Stage Labels:**
* "Stage 1": Text in the top-left quadrant of the chart area.
* "Stage 2": Text in the top-right quadrant of the chart area.
* **Visual Separator:** A vertical dashed gray line divides the chart into Stage 1 (left) and Stage 2 (right).
### Detailed Analysis
**1. LiveCodeBench-v6 (Blue Line, Left Y-Axis):**
* **Trend:** Shows a strong, generally upward trend across both stages, with a notable dip in Stage 2.
* **Stage 1:** Starts at a low value (approx. 0.1-0.2 on its scale). It dips slightly initially, then climbs steadily and steeply throughout the stage, ending at a high point just before the stage transition.
* **Stage 2:** Begins at a peak (approx. 0.8-0.9). It then experiences a sharp decline to a local minimum (approx. 0.6-0.7) before recovering and climbing again to finish at its highest point on the chart (approx. 0.9-1.0).
**2. R_correctness (Orange Line, Right Y-Axis):**
* **Trend:** Exhibits a fluctuating but overall upward trend, with more volatility than the blue line.
* **Stage 1:** Starts at a moderate value. It rises, dips, rises again to a peak, then falls before rising sharply to meet the blue line at the stage transition.
* **Stage 2:** Starts high, dips slightly, then follows a path that closely mirrors the blue line's dip and recovery, though it remains slightly above the blue line for most of Stage 2. It ends at a very high value, near its peak.
**3. R_time (Green Line, Right Y-Axis):**
* **Trend:** Shows a steady, linear upward trend. This metric is only plotted during Stage 2.
* **Stage 2:** Appears at the start of Stage 2 at a low-to-moderate value. It increases at a constant, moderate slope throughout the remainder of the chart, ending at a value significantly higher than its start but lower than the final values of the other two metrics.
### Key Observations
1. **Stage Transition Correlation:** The most significant event occurs at the vertical dashed line (start of Stage 2). The `LiveCodeBench-v6` (blue) and `R_correctness` (orange) scores both peak just before this line, then immediately drop.
2. **Divergence in Stage 2:** Following the initial drop in Stage 2, all three metrics recover and trend upward. However, `R_time` (green) increases linearly, while `LiveCodeBench-v6` (blue) and `R_correctness` (orange) show a correlated dip-and-recovery pattern.
3. **Metric Introduction:** The `R_time` reward signal is only active or visualized during Stage 2, suggesting a change in the training objective or reward function at that point.
4. **Final Convergence:** By the end of the chart, all three metrics are trending upward, with `LiveCodeBench-v6` and `R_correctness` reaching their highest observed values.
### Interpretation
This chart visualizes the training dynamics of a two-stage RL process for code generation. The data suggests:
* **Stage 1** focuses on improving code correctness (`R_correctness`), which drives the primary benchmark score (`LiveCodeBench-v6`) upward. The close correlation between the orange and blue lines indicates correctness is a major component of the benchmark score.
* The **transition to Stage 2** introduces a new optimization pressure, likely related to code efficiency or speed, represented by the `R_time` reward. The immediate dip in the benchmark and correctness scores suggests this new objective initially conflicts with or complicates the existing policy, causing a temporary performance drop.
* **Stage 2** demonstrates the system's ability to adapt and optimize for multiple objectives simultaneously. After the initial perturbation, the agent learns to balance correctness and time efficiency, leading to a recovery and continued improvement in all metrics. The linear rise of `R_time` shows steady progress on the new objective, while the recovery of the other lines shows the system is not sacrificing correctness for speed.
* The **overall narrative** is one of successful curriculum learning: mastering a primary skill (correctness) in Stage 1, then refining it while adding a secondary skill (efficiency) in Stage 2, ultimately achieving a higher overall performance than focusing on correctness alone. The dip is a classic sign of the "plasticity-stability" dilemma in learning systems when a new task is introduced.