## Line Charts: Attention Norms Across Epochs in Layer 2 and Layer 12
### Overview
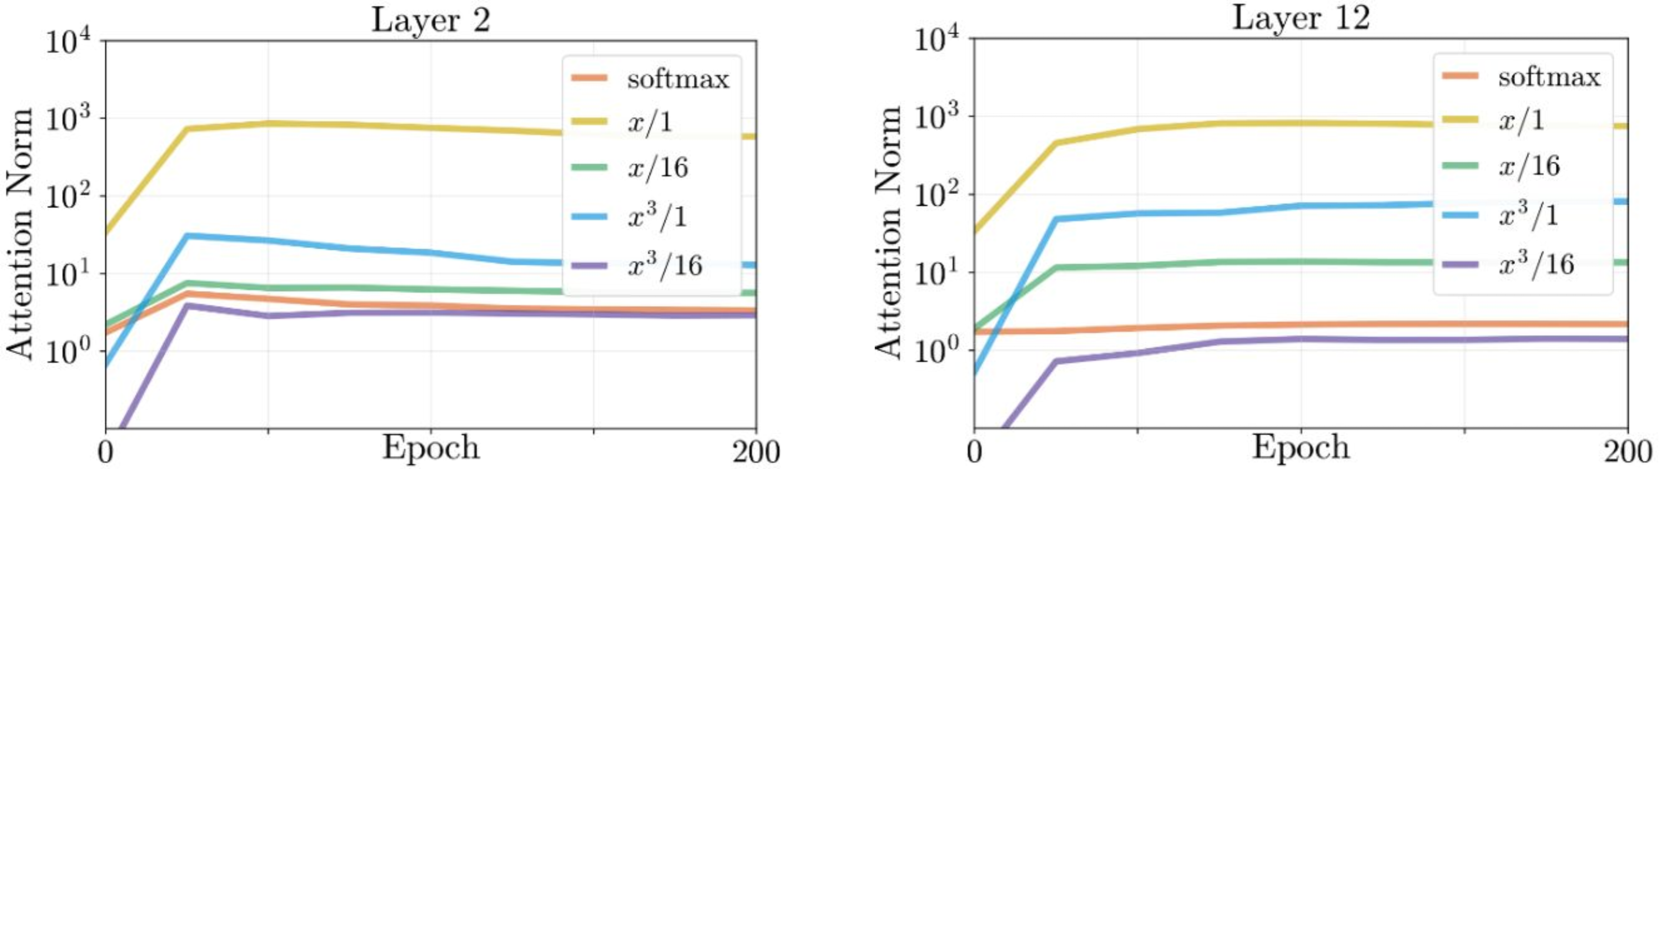
The image contains two line charts comparing attention norm trends across 200 epochs for different normalization methods in neural network layers. The charts are labeled "Layer 2" (left) and "Layer 12" (right). Both use logarithmic scales for attention norms (10⁰ to 10⁴) and linear scales for epochs (0–200). Five methods are compared: softmax, x/1, x/16, x³/1, and x³/16.
### Components/Axes
- **X-axis**: Epoch (0–200, linear scale)
- **Y-axis**: Attention Norm (logarithmic scale: 10⁰ to 10⁴)
- **Legends**:
- **Layer 2**:
- Softmax (orange)
- x/1 (yellow)
- x/16 (green)
- x³/1 (blue)
- x³/16 (purple)
- **Layer 12**: Same legend labels and colors as Layer 2.
### Detailed Analysis
#### Layer 2
- **Softmax (orange)**: Starts near 10⁰, spikes to ~10¹ at epoch 50, then drops to ~10⁰ by epoch 200.
- **x/1 (yellow)**: Begins at ~10¹, decreases slightly to ~10⁰.5 by epoch 200.
- **x/16 (green)**: Starts near 10⁰, rises to ~10⁰.5 by epoch 50, then stabilizes.
- **x³/1 (blue)**: Begins at ~10⁰, rises sharply to ~10¹.5 by epoch 50, then plateaus.
- **x³/16 (purple)**: Starts near 10⁰, rises gradually to ~10⁰.5 by epoch 150, then stabilizes.
#### Layer 12
- **Softmax (orange)**: Remains flat at ~10⁰ throughout all epochs.
- **x/1 (yellow)**: Starts at ~10², drops to ~10¹ by epoch 50, then stabilizes.
- **x/16 (green)**: Begins near 10⁰, rises to ~10⁰.5 by epoch 50, then plateaus.
- **x³/1 (blue)**: Starts at ~10⁰, rises sharply to ~10² by epoch 50, then plateaus.
- **x³/16 (purple)**: Begins near 10⁰, rises gradually to ~10⁰.5 by epoch 150, then stabilizes.
### Key Observations
1. **Layer 2**:
- x³/1 and x³/16 methods show significantly higher attention norms than softmax after epoch 50.
- Softmax exhibits a transient spike, suggesting temporary attention amplification.
2. **Layer 12**:
- x³/1 and x³/16 methods dominate with attention norms exceeding 10¹, while softmax remains negligible.
- x/1 method shows a sharp decline, contrasting with Layer 2's gradual decay.
### Interpretation
The data demonstrates that normalization methods have layer-dependent effects on attention dynamics:
- **Higher exponents (x³)** amplify attention norms, particularly in later layers (Layer 12), suggesting stronger feature weighting in deeper networks.
- **Softmax** behaves differently across layers: transient spikes in Layer 2 vs. flat stability in Layer 12, possibly reflecting architectural differences (e.g., residual connections, layer normalization).
- **x/16 and x³/16** methods show gradual increases, indicating milder normalization effects compared to x/1 and x³/1.
These trends highlight the importance of method selection for attention regularization, with exponential scaling (x³) favoring higher attention magnitudes in deeper layers.