\n
## Violin Plot: Reliance Sensitivity by Model Configuration
### Overview
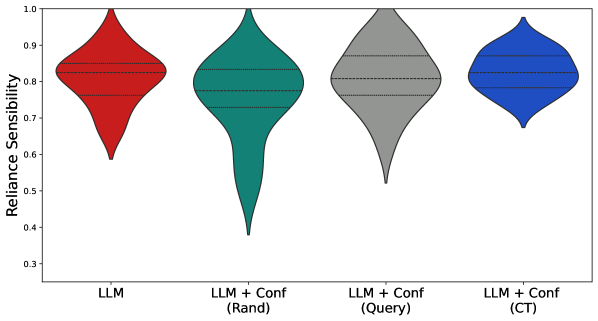
The image presents a violin plot comparing the "Reliance Sensitivity" across four different model configurations: "LLM", "LLM + Conf (Rand)", "LLM + Conf (Query)", and "LLM + Conf (CT)". The violin plots visualize the distribution of reliance sensitivity scores for each configuration.
### Components/Axes
* **X-axis:** Represents the model configuration. The categories are:
* LLM
* LLM + Conf (Rand)
* LLM + Conf (Query)
* LLM + Conf (CT)
* **Y-axis:** Labeled "Reliance Sensitivity", with a scale ranging from approximately 0.3 to 1.0.
* **Violin Plots:** Each model configuration has a corresponding violin plot, showing the distribution of reliance sensitivity scores. A white line within each violin plot indicates the median value.
### Detailed Analysis
Let's analyze each violin plot individually:
1. **LLM (Red):** The violin plot is centered around a median value of approximately 0.88. The distribution is relatively narrow, indicating a consistent reliance sensitivity. The range extends from approximately 0.65 to 0.98.
2. **LLM + Conf (Rand) (Teal):** This plot has a median value of approximately 0.83. The distribution is wider than the LLM plot, suggesting more variability in reliance sensitivity. The range extends from approximately 0.4 to 0.95.
3. **LLM + Conf (Query) (Gray):** The median value is approximately 0.85. The distribution is the widest of the four, indicating the most variability in reliance sensitivity. The range extends from approximately 0.5 to 1.0.
4. **LLM + Conf (CT) (Blue):** The median value is approximately 0.91. The distribution is relatively narrow, similar to the LLM plot, but slightly shifted towards higher values. The range extends from approximately 0.75 to 0.99.
### Key Observations
* The "LLM + Conf (CT)" configuration exhibits the highest median reliance sensitivity (approximately 0.91).
* The "LLM + Conf (Query)" configuration shows the greatest variability in reliance sensitivity.
* The "LLM" configuration has a relatively consistent reliance sensitivity, with a median of approximately 0.88.
* Adding confidence information ("Conf") generally shifts the distributions, but the effect varies depending on the method used (Rand, Query, CT).
### Interpretation
The data suggests that incorporating confidence information into the LLM can influence reliance sensitivity. The "CT" method appears to be the most effective at increasing reliance sensitivity, as indicated by its higher median value. The "Query" method, while also increasing reliance sensitivity, introduces the most variability. This could indicate that the confidence scores generated by the "Query" method are less reliable or more context-dependent. The "Rand" method shows a moderate increase in reliance sensitivity, but with a wider distribution than the base LLM.
The violin plots provide a visual representation of how different confidence augmentation strategies impact the consistency and magnitude of reliance sensitivity. The wider distributions for "LLM + Conf (Rand)" and "LLM + Conf (Query)" suggest that these methods may be more sensitive to specific input conditions or data points. The narrower distribution of "LLM + Conf (CT)" suggests a more robust and predictable effect on reliance sensitivity.
The data implies that the choice of confidence augmentation method is crucial for controlling the level and consistency of reliance on the LLM's output. Further investigation is needed to understand the underlying reasons for the observed differences and to optimize the confidence augmentation process for specific applications.