## Chart: Answer Accuracy vs. Layer for Llama-3 Models
### Overview
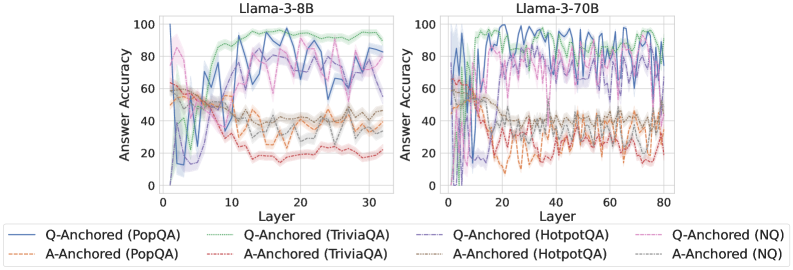
The image presents two line charts comparing the answer accuracy of Llama-3-8B and Llama-3-70B models across different layers. The x-axis represents the layer number, and the y-axis represents the answer accuracy. Each chart displays six data series, representing different question-answering datasets (PopQA, TriviaQA, HotpotQA, and NQ) anchored either by question (Q-Anchored) or answer (A-Anchored).
### Components/Axes
* **Titles:**
* Left Chart: Llama-3-8B
* Right Chart: Llama-3-70B
* **X-axis:**
* Label: Layer
* Left Chart: Scale from 0 to 30, with ticks at 0, 10, 20, and 30.
* Right Chart: Scale from 0 to 80, with ticks at 0, 20, 40, 60, and 80.
* **Y-axis:**
* Label: Answer Accuracy
* Scale from 0 to 100, with ticks at 0, 20, 40, 60, 80, and 100.
* **Legend:** Located at the bottom of the image.
* Q-Anchored (PopQA): Solid Blue Line
* A-Anchored (PopQA): Dashed Brown Line
* Q-Anchored (TriviaQA): Dotted Green Line
* A-Anchored (TriviaQA): Dash-Dotted Red Line
* Q-Anchored (HotpotQA): Dash-Dot-Dotted Purple Line
* A-Anchored (HotpotQA): Dotted Orange Line
* Q-Anchored (NQ): Dashed Purple Line
* A-Anchored (NQ): Dotted Gray Line
### Detailed Analysis
**Llama-3-8B (Left Chart):**
* **Q-Anchored (PopQA):** (Solid Blue Line) Starts at approximately 0% accuracy at layer 0, rises sharply to approximately 80% by layer 5, and then fluctuates between 80% and 100% for the remaining layers.
* **A-Anchored (PopQA):** (Dashed Brown Line) Starts at approximately 60% accuracy at layer 0, decreases to approximately 40% by layer 5, and then fluctuates around 40% for the remaining layers.
* **Q-Anchored (TriviaQA):** (Dotted Green Line) Starts at approximately 60% accuracy at layer 0, rises to approximately 90% by layer 10, and then fluctuates between 80% and 90% for the remaining layers.
* **A-Anchored (TriviaQA):** (Dash-Dotted Red Line) Starts at approximately 60% accuracy at layer 0, decreases to approximately 20% by layer 15, and then fluctuates around 20% for the remaining layers.
* **Q-Anchored (HotpotQA):** (Dash-Dot-Dotted Purple Line) Starts at approximately 60% accuracy at layer 0, rises to approximately 80% by layer 10, and then fluctuates between 70% and 80% for the remaining layers.
* **A-Anchored (HotpotQA):** (Dotted Orange Line) Starts at approximately 60% accuracy at layer 0, decreases to approximately 30% by layer 10, and then fluctuates around 30% for the remaining layers.
* **Q-Anchored (NQ):** (Dashed Purple Line) Starts at approximately 60% accuracy at layer 0, rises to approximately 80% by layer 10, and then fluctuates between 70% and 80% for the remaining layers.
* **A-Anchored (NQ):** (Dotted Gray Line) Starts at approximately 60% accuracy at layer 0, decreases to approximately 40% by layer 10, and then fluctuates around 40% for the remaining layers.
**Llama-3-70B (Right Chart):**
* **Q-Anchored (PopQA):** (Solid Blue Line) Starts at approximately 0% accuracy at layer 0, rises sharply to approximately 90% by layer 5, and then fluctuates between 80% and 100% for the remaining layers.
* **A-Anchored (PopQA):** (Dashed Brown Line) Starts at approximately 60% accuracy at layer 0, decreases to approximately 40% by layer 10, and then fluctuates around 40% for the remaining layers.
* **Q-Anchored (TriviaQA):** (Dotted Green Line) Starts at approximately 60% accuracy at layer 0, rises to approximately 90% by layer 10, and then fluctuates between 80% and 100% for the remaining layers.
* **A-Anchored (TriviaQA):** (Dash-Dotted Red Line) Starts at approximately 60% accuracy at layer 0, decreases to approximately 20% by layer 20, and then fluctuates around 20% for the remaining layers.
* **Q-Anchored (HotpotQA):** (Dash-Dot-Dotted Purple Line) Starts at approximately 60% accuracy at layer 0, rises to approximately 80% by layer 10, and then fluctuates between 70% and 90% for the remaining layers.
* **A-Anchored (HotpotQA):** (Dotted Orange Line) Starts at approximately 60% accuracy at layer 0, decreases to approximately 30% by layer 10, and then fluctuates around 30% for the remaining layers.
* **Q-Anchored (NQ):** (Dashed Purple Line) Starts at approximately 60% accuracy at layer 0, rises to approximately 80% by layer 10, and then fluctuates between 70% and 90% for the remaining layers.
* **A-Anchored (NQ):** (Dotted Gray Line) Starts at approximately 60% accuracy at layer 0, decreases to approximately 40% by layer 10, and then fluctuates around 40% for the remaining layers.
### Key Observations
* For both models, Q-Anchored datasets (PopQA, TriviaQA) generally achieve higher answer accuracy than A-Anchored datasets.
* The Q-Anchored (PopQA) dataset shows a rapid increase in accuracy in the initial layers for both models.
* The A-Anchored datasets (TriviaQA, HotpotQA) show a decrease in accuracy in the initial layers for both models.
* The Llama-3-70B model has a longer x-axis (more layers) than the Llama-3-8B model, but the trends are similar.
* The shaded regions around each line represent the uncertainty or variance in the answer accuracy.
### Interpretation
The data suggests that anchoring the question (Q-Anchored) leads to better performance than anchoring the answer (A-Anchored) for these Llama-3 models. The rapid increase in accuracy for Q-Anchored (PopQA) in the initial layers indicates that the model quickly learns to answer these types of questions. The decrease in accuracy for A-Anchored datasets suggests that the model struggles to generate accurate answers when conditioned on the answer itself. The Llama-3-70B model, with its increased number of layers, exhibits similar trends to the Llama-3-8B model, suggesting that the core learning dynamics are consistent across different model sizes. The uncertainty regions highlight the variability in the model's performance, which could be due to factors such as the specific questions being asked or the training data distribution.