# Technical Data Extraction: Control Effect Analysis Across Model Layers
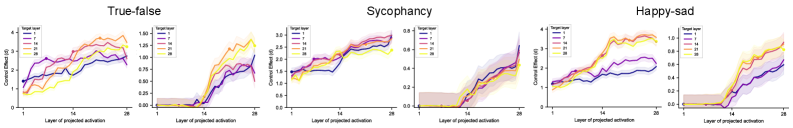
This document provides a comprehensive extraction of data from a series of six line charts organized into three primary categories: **True-false**, **Sycophancy**, and **Happy-sad**. Each category contains two sub-plots showing the "Control Effect (d)" relative to the "Layer of projected activation."
---
## 1. Global Metadata and Legend
* **Language:** English
* **X-Axis Label:** Layer of projected activation (Values marked at 1, 14, and 28).
* **Y-Axis Label:** Control Effect (d)
* **Legend Location:** Top-left of each individual plot.
* **Legend Categories (Target Layer):**
* **1** (Dark Blue)
* **7** (Purple)
* **14** (Magenta/Pink)
* **21** (Orange)
* **28** (Yellow)
* **Visual Representation:** Solid lines represent the mean effect, while shaded regions around the lines indicate confidence intervals or variance.
---
## 2. Category: True-false
### Plot A (Left)
* **Y-Axis Range:** 0 to 4
* **Trend Analysis:** All target layers show a positive upward slope as the layer of projected activation increases.
* **Data Observations:**
* **Layer 21 (Orange) & 28 (Yellow):** Start lowest (~0.8) but show the steepest climb, peaking near 3.5–4.0 at layer 28.
* **Layer 1 (Dark Blue):** Starts highest at layer 1 (~1.5) but has the shallowest slope, ending around 2.5.
* **Layer 7 (Purple) & 14 (Pink):** Maintain middle-ground trajectories, ending between 2.5 and 3.0.
### Plot B (Right)
* **Y-Axis Range:** 0.0 to 1.50
* **Trend Analysis:** Flat/Zero effect until approximately layer 14, followed by a sharp non-linear increase.
* **Data Observations:**
* **Layer 21 (Orange) & 28 (Yellow):** Show the most significant late-stage increase, reaching ~1.25 to 1.4.
* **Layer 1 (Dark Blue):** Shows the latest and weakest response, ending near 1.0.
---
## 3. Category: Sycophancy
### Plot A (Left)
* **Y-Axis Range:** 0.0 to 3.0
* **Trend Analysis:** Steady, linear-like growth across all layers.
* **Data Observations:**
* **Layer 1 (Dark Blue):** Starts at ~1.5. It plateaus between layers 7 and 14 before rising again to ~2.8.
* **Layer 14 (Pink) & 21 (Orange):** Closely clustered, rising from ~1.3 to ~3.0.
* **Layer 28 (Yellow):** Shows a slightly lower terminal value (~2.4) compared to the middle layers.
### Plot B (Right)
* **Y-Axis Range:** 0.0 to 0.8
* **Trend Analysis:** Near-zero effect until layer 14, then a steady climb.
* **Data Observations:**
* **Layer 1 (Dark Blue):** Shows a distinct spike at the final layer (28), reaching ~0.6.
* **Layer 7 (Purple):** Follows a similar trajectory to Layer 1 but with a slightly lower peak.
* **Layer 21 (Orange) & 28 (Yellow):** Rise to approximately 0.4–0.5.
---
## 4. Category: Happy-sad
### Plot A (Left)
* **Y-Axis Range:** 0 to 4
* **Trend Analysis:** Rapid increase between layers 1 and 14, followed by a plateau or slight decline toward layer 28.
* **Data Observations:**
* **Layer 21 (Orange) & 28 (Yellow):** Exhibit the strongest effect, peaking at ~3.5 around layer 18-20 before stabilizing.
* **Layer 1 (Dark Blue):** Shows the most muted response, plateauing early at a value of ~1.8.
* **Layer 7 (Purple):** Ends at approximately 2.2.
### Plot B (Right)
* **Y-Axis Range:** 0.0 to 1.0
* **Trend Analysis:** Zero effect until layer 14, followed by a sharp, consistent upward trend.
* **Data Observations:**
* **Layer 21 (Orange) & 28 (Yellow):** Lead the increase, reaching the highest values of ~0.8 to 0.9.
* **Layer 1 (Dark Blue) & 7 (Purple):** Show a delayed response compared to higher layers, ending between 0.6 and 0.7.
---
## 5. Summary of Patterns
1. **Layer Dependency:** In all "Right-side" plots for each category, there is a "dead zone" where no control effect is measured until the projected activation reaches the middle layers (approx. layer 14).
2. **Magnitude:** The "True-false" and "Happy-sad" categories show higher absolute control effects (up to 4.0d) compared to "Sycophancy" (up to 3.0d).
3. **Late-Layer Dominance:** Generally, target layers 21 (Orange) and 28 (Yellow) result in the highest control effects as the activation layer increases, particularly in the second sub-plots of each category.