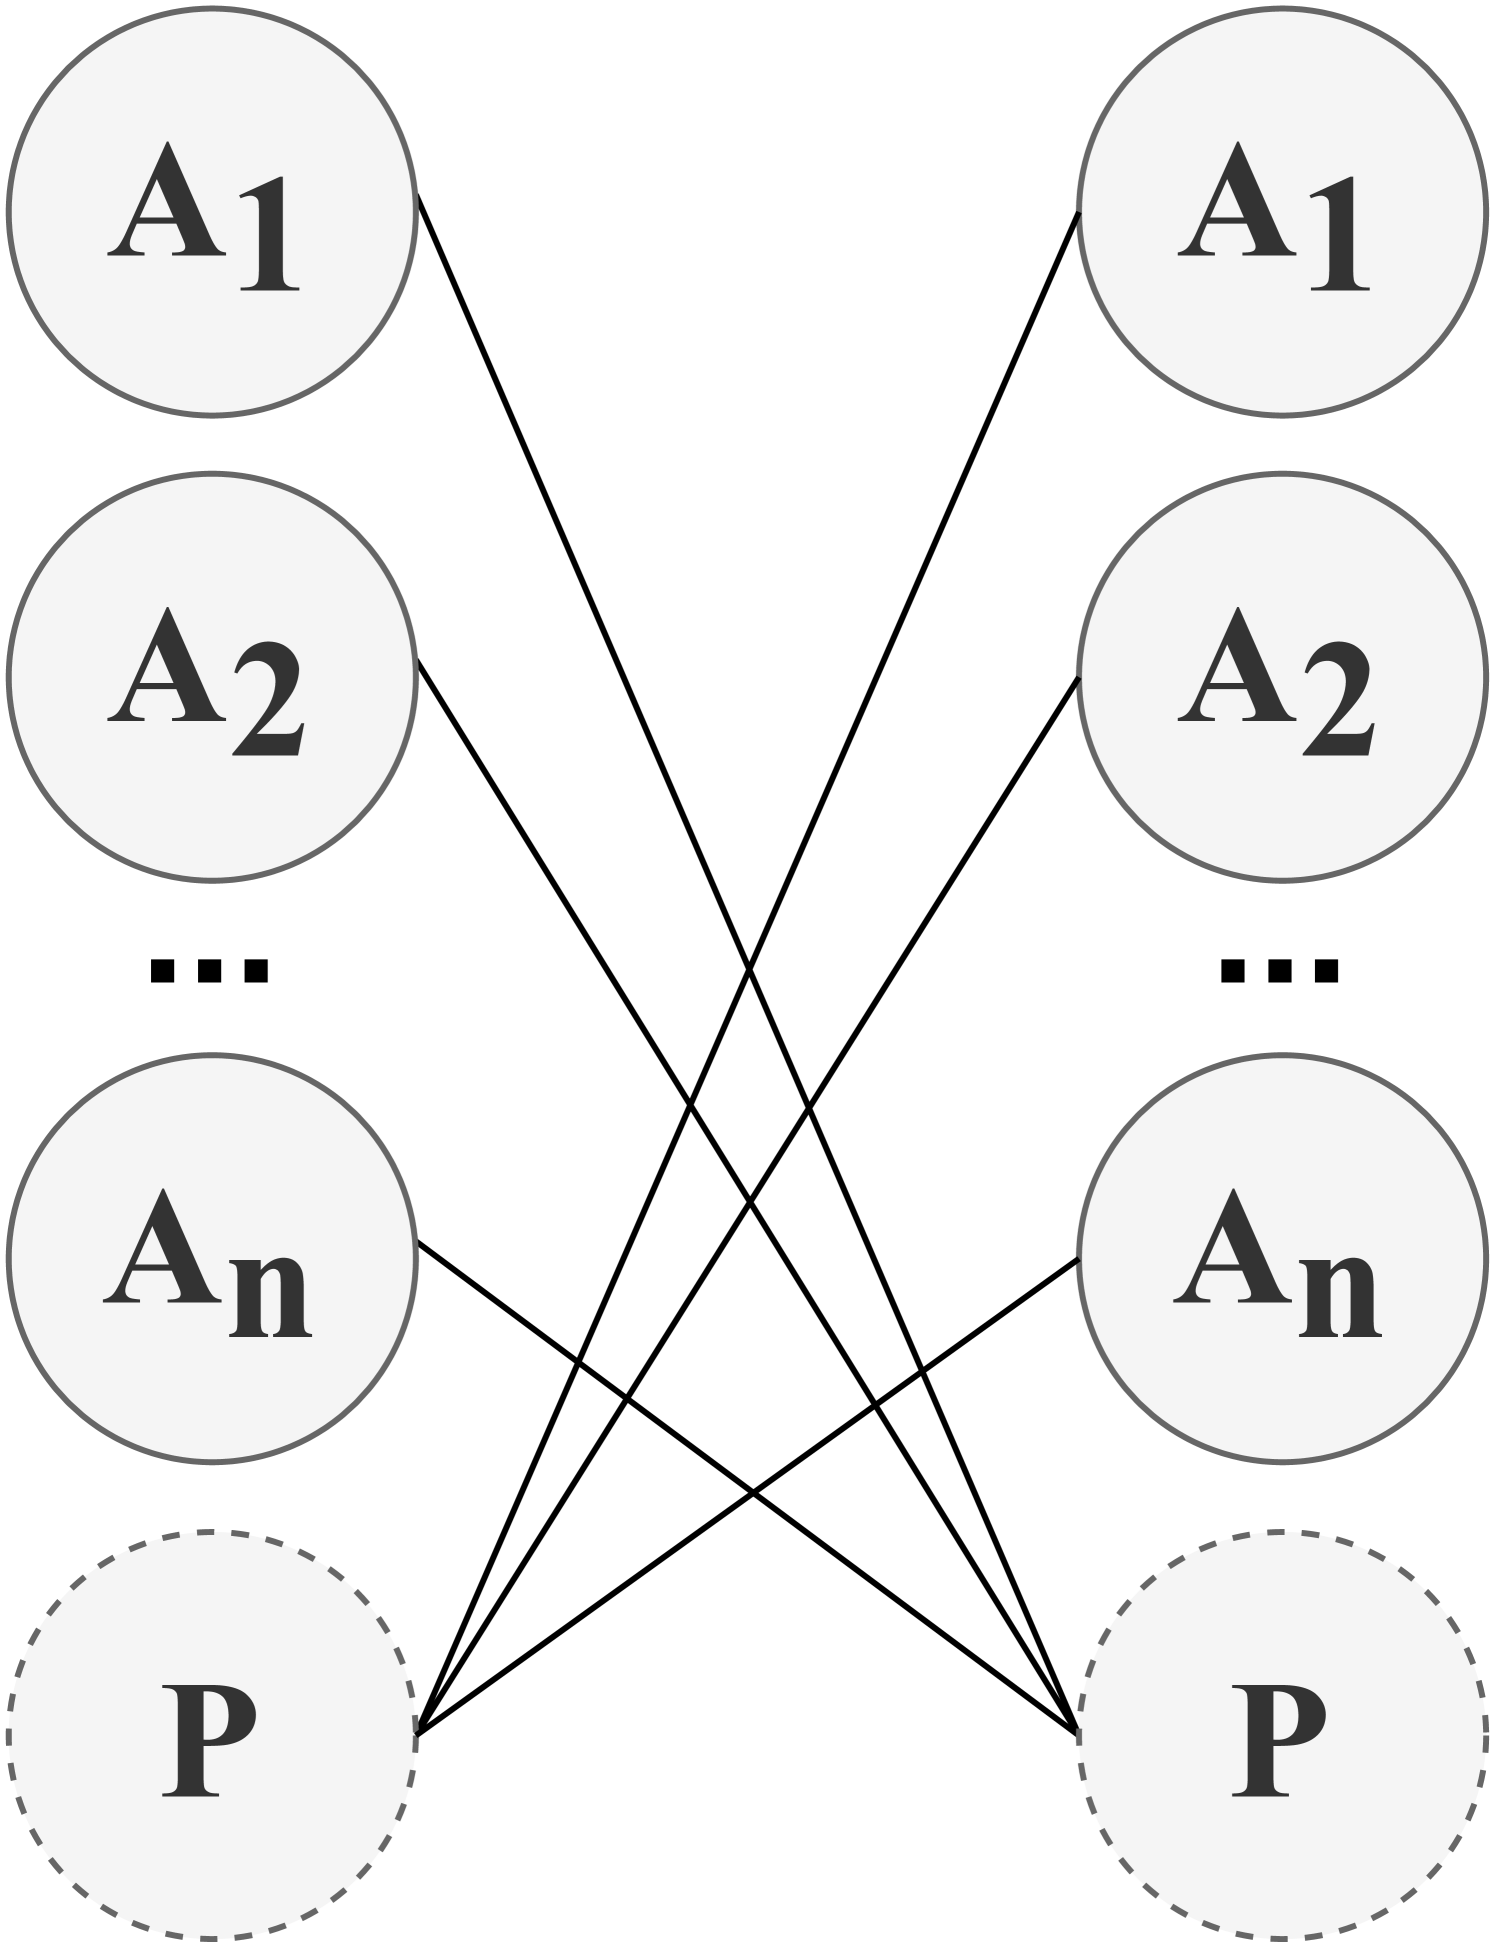
## Diagram: Bipartite Mapping Network
### Overview
The image displays a schematic diagram representing a bipartite graph or mapping between two distinct sets of nodes arranged in two vertical columns. The diagram illustrates a many-to-many relationship or connection pattern between elements of the left set and elements of the right set.
### Components/Axes
**Structure:** Two parallel vertical columns of circular nodes.
**Left Column Nodes (Top to Bottom):**
1. A solid-outlined circle labeled **A₁**.
2. A solid-outlined circle labeled **A₂**.
3. An ellipsis (**...**), indicating a sequence of intermediate nodes.
4. A solid-outlined circle labeled **Aₙ**.
5. A dashed-outlined circle labeled **P**.
**Right Column Nodes (Top to Bottom):**
1. A solid-outlined circle labeled **A₁**.
2. A solid-outlined circle labeled **A₂**.
3. An ellipsis (**...**), indicating a sequence of intermediate nodes.
4. A solid-outlined circle labeled **Aₙ**.
5. A dashed-outlined circle labeled **P**.
**Connections:** Straight black lines connect nodes from the left column to nodes in the right column. The connections are not one-to-one but form a crisscrossing network.
### Detailed Analysis
**Node Labels and Types:**
* **A₁, A₂, ..., Aₙ:** These labels use subscript notation (₁, ₂, ₙ) to denote a sequence or series of similar entities. The ellipsis confirms the sequence extends from index 2 to index n.
* **P:** This label is distinct, appearing in a circle with a dashed outline, suggesting it may represent a different type of entity (e.g., a placeholder, a special node, or a different category) compared to the "A" nodes.
**Connection Pattern (Visible Lines):**
The diagram shows a partial but illustrative set of connections. Tracing the visible lines reveals the following mappings:
* Left **A₁** connects to Right **A₂** and Right **P**.
* Left **A₂** connects to Right **A₁** and Right **P**.
* Left **Aₙ** connects to Right **A₁** and Right **A₂**.
* Left **P** connects to Right **A₁**, Right **A₂**, and Right **Aₙ**.
**Spatial Grounding:** The legend (node labels) is integrated directly into the diagram within each node. The connections are drawn as straight lines crossing the central space between the two columns.
### Key Observations
1. **Symmetry and Repetition:** The two columns are identical in their composition and labeling, suggesting a mapping between two instances of the same set or a reflection.
2. **Dense Interconnection:** The visible lines show that each node on the left is connected to multiple nodes on the right, and vice-versa. This indicates a complex, non-hierarchical relationship.
3. **Special Status of 'P':** The node labeled 'P' is visually distinct (dashed outline) and appears to be highly connected, linking to multiple 'A' nodes in the opposite column.
4. **Ellipsis Implication:** The ellipses (...) signify that the diagram is a generalized representation. The actual number of 'A' nodes (n) is variable and could be large, making the full connection pattern potentially very dense.
### Interpretation
This diagram is a conceptual model, not a data chart. It visually communicates the architecture of a system where two groups of entities (the left and right columns) interact.
* **What it Demonstrates:** It illustrates a **bipartite graph** where connections only exist between nodes of different columns, not within the same column. This is common in modeling relationships like users-to-permissions, inputs-to-outputs, or clients-to-services.
* **Relationship Between Elements:** The crisscrossing lines emphasize that the mapping is arbitrary and complex. There is no implied order or hierarchy; any 'A' or 'P' node on one side can potentially connect to any node on the other side.
* **Role of 'P':** The dashed outline and central connectivity suggest 'P' may represent a **proxy, a processor, a shared resource, or a special gateway node** that interacts with all or many of the standard 'A' entities. Its distinct styling marks it as functionally different.
* **Generalization:** The use of 'Aₙ' and ellipses makes this a template diagram. It is meant to be applicable to any system with this bipartite structure, regardless of the specific number of 'A' components. The specific connections shown are for illustrative purposes only; the actual connectivity in a real system would be defined by its rules.
**In essence, the image provides a structural blueprint for a networked system characterized by two mirrored sets of components and a complex, many-to-many connection scheme between them, with a special component 'P' playing a highly interconnected role.**