## Scatter Plots: Music Genre Distribution in Valid and Test Sets
### Overview
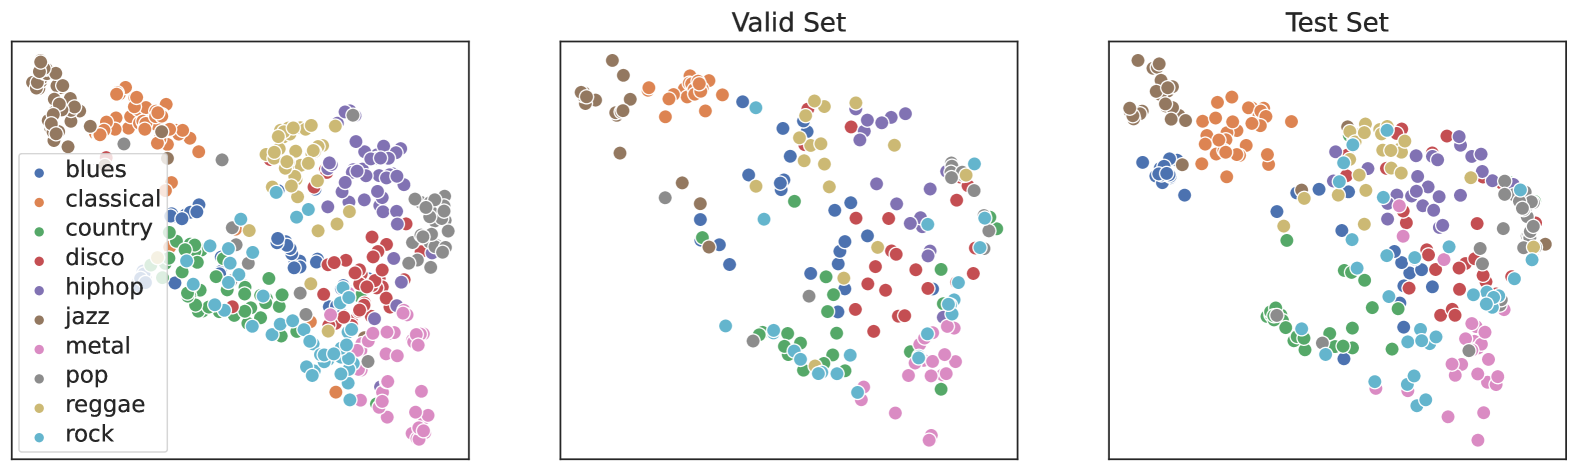
Three scatter plots are presented, each representing the distribution of music genres in a dataset. The plots are labeled "Valid Set" (left) and "Test Set" (right), with a third unlabeled plot (likely a duplicate or mislabeled). Each genre is represented by a distinct color, as indicated in the legend on the left. The axes are labeled "Feature 1" (x-axis) and "Feature 2" (y-axis), suggesting dimensionality reduction or feature space visualization.
### Components/Axes
- **Legend**: Located on the left of all plots, mapping colors to genres:
- Blues (blue), Classical (orange), Country (green), Disco (red), Hip-hop (purple), Jazz (brown), Metal (pink), Pop (gray), Reggae (yellow), Rock (cyan).
- **Axes**:
- X-axis: "Feature 1" (no units specified).
- Y-axis: "Feature 2" (no units specified).
- **Plots**:
- **Valid Set** (left): Clear separation of genres with minimal overlap.
- **Test Set** (right): Increased overlap between genres compared to the Valid Set.
- **Unlabeled Plot** (center): Identical to the Valid Set, suggesting a possible duplication or mislabeling.
### Detailed Analysis
- **Valid Set**:
- **Blues** (blue): Clustered in the top-left quadrant.
- **Classical** (orange): Dominates the top-right quadrant.
- **Country** (green): Concentrated in the bottom-left quadrant.
- **Disco** (red): Scattered across the middle-right.
- **Hip-hop** (purple): Spread across the middle.
- **Jazz** (brown): Small cluster in the top-left.
- **Metal** (pink): Bottom-right quadrant.
- **Pop** (gray): Scattered across the middle.
- **Reggae** (yellow): Middle-right quadrant.
- **Rock** (cyan): Bottom-middle quadrant.
- **Test Set**:
- **Blues** (blue): Overlaps with Jazz and Hip-hop in the middle-left.
- **Classical** (orange): Still top-right but with some overlap from Pop and Reggae.
- **Country** (green): Spread into the middle-left, overlapping with Blues.
- **Disco** (red): More dispersed, overlapping with Hip-hop and Pop.
- **Hip-hop** (purple): Expands into the bottom-middle, overlapping with Rock.
- **Jazz** (brown): Minimal presence, merged with Blues.
- **Metal** (pink): Bottom-right, slightly overlapping with Reggae.
- **Pop** (gray): Widely distributed, overlapping with multiple genres.
- **Reggae** (yellow): Middle-right, overlapping with Classical and Disco.
- **Rock** (cyan): Bottom-middle, overlapping with Hip-hop and Pop.
- **Unlabeled Plot**: Identical to the Valid Set, with no discernible differences.
### Key Observations
1. **Genre Separation**: The Valid Set shows distinct clusters for most genres (e.g., Classical in top-right, Country in bottom-left), while the Test Set exhibits significant overlap (e.g., Blues merging with Jazz, Pop spreading across the plot).
2. **Overlap Patterns**:
- Blues and Jazz overlap in the Test Set but remain separate in the Valid Set.
- Pop and Reggae intrude into Classical’s top-right region in the Test Set.
3. **Consistency**: The unlabeled plot mirrors the Valid Set, suggesting it may be a duplicate or mislabeled.
### Interpretation
The scatter plots likely visualize the feature space of music genres in a machine learning context, where the Valid Set represents training data and the Test Set represents unseen data. The increased overlap in the Test Set implies:
- **Feature Similarity**: Genres in the Test Set share more attributes (e.g., tempo, instrumentation) than in the Valid Set, reducing separability.
- **Potential Data Leakage**: Overlap between genres like Blues and Jazz in the Test Set could indicate unintended data contamination or insufficient feature engineering.
- **Model Robustness**: The Test Set’s reduced genre separation may challenge classification models, highlighting the need for better feature differentiation or regularization.
The unlabeled plot’s duplication raises questions about dataset integrity, warranting verification of labeling accuracy. Overall, the visualization underscores the importance of feature selection and data preprocessing in music genre classification tasks.