## Line Chart: Accuracy vs. Thinking Compute
### Overview
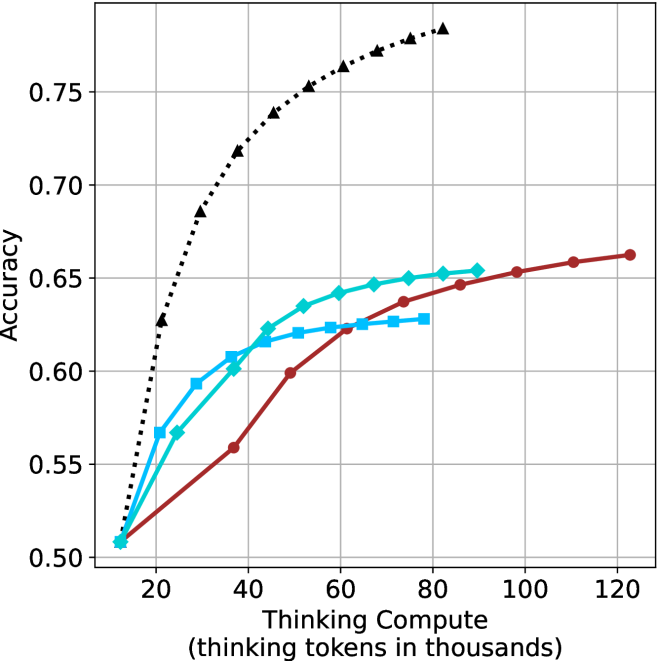
This chart illustrates the relationship between "Thinking Compute" (measured in thousands of thinking tokens) and "Accuracy" for four distinct data series. The chart demonstrates how increasing computational resources (thinking tokens) impacts the accuracy of different models or configurations. All four series originate from a common starting point and exhibit diminishing returns as compute increases.
### Components/Axes
* **Y-Axis:** Labeled "Accuracy". The scale ranges from 0.50 to 0.75, with grid lines at 0.05 intervals.
* **X-Axis:** Labeled "Thinking Compute (thinking tokens in thousands)". The scale ranges from 20 to 120, with grid lines at 20-unit intervals.
* **Data Series (Legend inferred from visual markers):**
* **Black Dotted Line (Triangle markers):** Represents the highest-performing model.
* **Cyan Solid Line (Diamond markers):** Represents a mid-range performing model.
* **Blue Solid Line (Square markers):** Represents a mid-range performing model.
* **Dark Red Solid Line (Circle markers):** Represents the slowest-scaling model.
### Detailed Analysis
All four data series originate from a common coordinate at approximately **(12, 0.51)**.
**1. Black Dotted Line (Triangles)**
* **Trend:** This series exhibits the steepest upward slope, indicating the highest efficiency in converting compute into accuracy.
* **Data Points:**
* Starts at ~0.51 (12k tokens).
* Rises sharply to ~0.63 at 20k tokens.
* Reaches ~0.68 at 30k tokens.
* Reaches ~0.72 at 38k tokens.
* Reaches ~0.74 at 45k tokens.
* Reaches ~0.75 at 55k tokens.
* Continues to rise, ending at approximately 82k tokens with an accuracy of ~0.78.
**2. Cyan Solid Line (Diamonds)**
* **Trend:** Moderate upward slope that begins to flatten significantly after 60k tokens.
* **Data Points:**
* Starts at ~0.51 (12k tokens).
* Reaches ~0.57 at 25k tokens.
* Reaches ~0.60 at 38k tokens.
* Reaches ~0.62 at 45k tokens.
* Reaches ~0.64 at 52k tokens.
* Flattens out, ending at approximately 90k tokens with an accuracy of ~0.655.
**3. Blue Solid Line (Squares)**
* **Trend:** Moderate upward slope, similar to the Cyan line, but flattens earlier.
* **Data Points:**
* Starts at ~0.51 (12k tokens).
* Reaches ~0.57 at 20k tokens.
* Reaches ~0.59 at 28k tokens.
* Reaches ~0.61 at 36k tokens.
* Reaches ~0.62 at 45k tokens.
* Plateaus, ending at approximately 80k tokens with an accuracy of ~0.63.
**4. Dark Red Solid Line (Circles)**
* **Trend:** The most gradual, linear upward slope. It does not plateau as aggressively as the other lines within the visible range.
* **Data Points:**
* Starts at ~0.51 (12k tokens).
* Reaches ~0.56 at 36k tokens.
* Reaches ~0.60 at 48k tokens.
* Reaches ~0.62 at 62k tokens.
* Reaches ~0.64 at 75k tokens.
* Reaches ~0.65 at 88k tokens.
* Continues to rise, ending at approximately 122k tokens with an accuracy of ~0.665.
### Key Observations
* **Performance Disparity:** The black dotted line is a clear outlier, achieving significantly higher accuracy for the same amount of compute compared to the other three models.
* **Crossover Points:**
* The Cyan (diamond) and Blue (square) lines cross at approximately 40k tokens and 0.62 accuracy.
* The Dark Red (circle) line, despite starting with the slowest growth, overtakes the Blue (square) line at approximately 65k tokens.
* **Diminishing Returns:** All models show a concave shape, indicating that as more "thinking tokens" are added, the marginal gain in accuracy decreases.
### Interpretation
This chart demonstrates the "scaling laws" of reasoning models. The black dotted line represents a model architecture or training regime that is vastly more efficient at utilizing computational "thinking" time than the other three models.
The other three models (Cyan, Blue, Red) appear to be variations of a less efficient architecture. While they all improve with more compute, they hit a "ceiling" much earlier than the black model. The fact that the Red line continues to climb slowly while the Blue and Cyan lines plateau suggests that the Red model might have a higher theoretical capacity or different optimization characteristics, even if it is less efficient in the short term. This data is typical of research comparing different model sizes or "test-time compute" scaling strategies.