\n
## Line Chart: Validation Loss vs. Training Tokens
### Overview
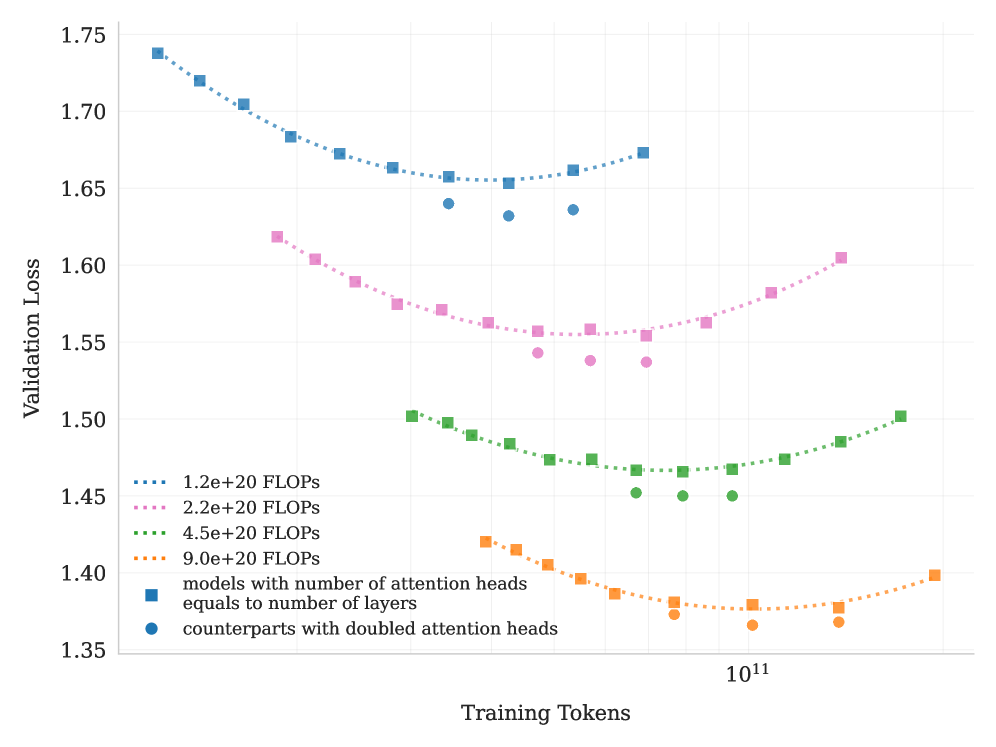
This chart displays the relationship between Validation Loss and Training Tokens for several models with varying computational costs (measured in FLOPS) and attention head configurations. The chart aims to demonstrate how model size and attention mechanisms affect validation performance during training.
### Components/Axes
* **X-axis:** Training Tokens, ranging from approximately 0 to 1.2e11 (120 billion). The scale is logarithmic, with a marker at 10^11.
* **Y-axis:** Validation Loss, ranging from approximately 1.35 to 1.75.
* **Legend:** Located in the bottom-left corner, detailing the different model configurations:
* `1.2e+20 FLOPS` (dotted orange line)
* `2.2e+20 FLOPS` (dotted pink line)
* `4.5e+20 FLOPS` (dotted green line)
* `9.0e+20 FLOPS` (dotted purple line)
* `models with number of attention heads equals to number of layers` (solid blue squares)
* `counterparts with doubled attention heads` (solid teal circles)
### Detailed Analysis
The chart contains six distinct data series, each representing a different model configuration.
* **1.2e+20 FLOPS (Orange):** The line starts at approximately 1.42 validation loss at 0 training tokens, decreases to a minimum of around 1.37 at approximately 5e10 training tokens, and then increases slightly to around 1.40 at 1.2e11 training tokens.
* **2.2e+20 FLOPS (Pink):** The line begins at approximately 1.62 validation loss at 0 training tokens, gradually decreases to around 1.55 at approximately 8e10 training tokens, and then plateaus around 1.56-1.60.
* **4.5e+20 FLOPS (Green):** The line starts at approximately 1.48 validation loss at 0 training tokens, decreases to a minimum of around 1.43 at approximately 6e10 training tokens, and then increases to around 1.48 at 1.2e11 training tokens.
* **9.0e+20 FLOPS (Purple):** The line begins at approximately 1.65 validation loss at 0 training tokens, decreases to around 1.60 at approximately 8e10 training tokens, and then plateaus around 1.60-1.62.
* **Models with number of attention heads equals to number of layers (Blue):** The line starts at approximately 1.73 validation loss at 0 training tokens, decreases steadily to around 1.66 at approximately 1.0e11 training tokens, and then plateaus around 1.66-1.68.
* **Counterparts with doubled attention heads (Teal):** The line begins at approximately 1.68 validation loss at 0 training tokens, decreases to around 1.65 at approximately 4e10 training tokens, and then increases to around 1.68 at 1.2e11 training tokens.
### Key Observations
* The models with fewer FLOPS (1.2e+20 and 4.5e+20) generally exhibit lower validation loss than those with more FLOPS, especially in the initial stages of training.
* The model with the fewest FLOPS (1.2e+20) shows a clear initial decrease in validation loss, followed by a slight increase, suggesting potential overfitting or reaching a local minimum.
* The models with doubled attention heads (teal) consistently perform slightly worse than their counterparts with standard attention heads (blue).
* The lines representing higher FLOPS models (2.2e+20 and 9.0e+20) show a more gradual decrease in validation loss and tend to plateau at higher loss values.
* All lines exhibit a decreasing trend in validation loss during the initial phase of training, indicating learning.
### Interpretation
The data suggests that increasing model size (FLOPS) does not necessarily lead to better validation performance. In fact, smaller models can achieve lower validation loss, potentially due to reduced overfitting or more efficient learning. The comparison between models with standard and doubled attention heads indicates that simply increasing the number of attention heads does not guarantee improved performance and may even be detrimental. The plateauing of validation loss for all models suggests that they are approaching a point of diminishing returns, where further training yields minimal improvement. The initial decrease in validation loss across all models demonstrates that the training process is effective in reducing the error on the validation set. The slight increase in validation loss for some models at later stages of training could indicate overfitting or the need for regularization techniques. The logarithmic scale of the x-axis highlights the importance of considering the rate of learning over time, as the impact of each additional training token diminishes as the training progresses.