## Line Chart: Accuracy vs. Step for Different Models and Methods
### Overview
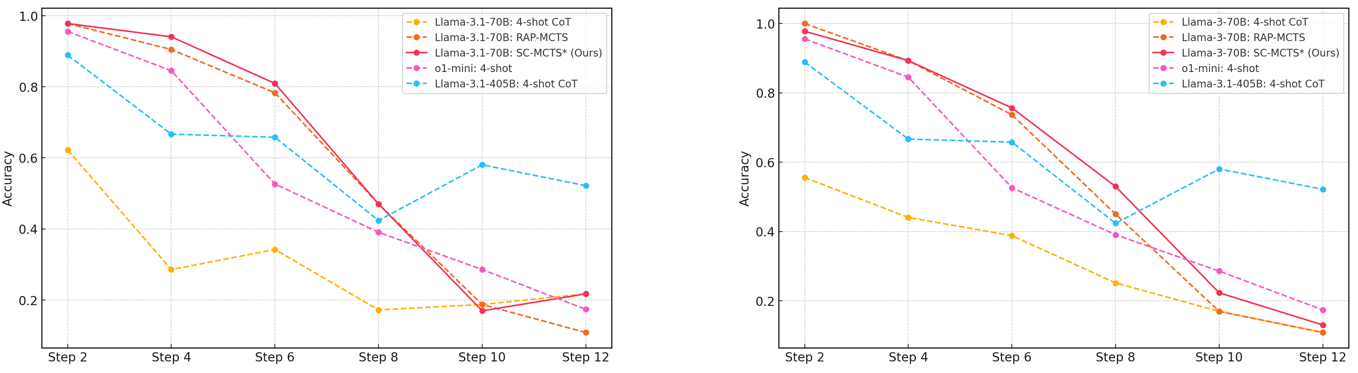
The image contains two side-by-side line charts comparing the accuracy of various AI models and methods across incremental steps (Step 2 to Step 12). Each subplot represents a different model version (Llama-3.1-70B and Llama-3.70B), with lines representing distinct methods (e.g., CoT, RAP-MCTS, SC-MCTS*). The charts show a general decline in accuracy as steps increase, with varying rates of degradation across methods.
---
### Components/Axes
- **X-axis (Horizontal)**: "Step" with markers at 2, 4, 6, 8, 10, 12.
- **Y-axis (Vertical)**: "Accuracy" scaled from 0.0 to 1.0.
- **Legends**:
- **Left Subplot**:
- Yellow: Llama-3.1-70B: 4-shot CoT
- Orange: Llama-3.1-70B: RAP-MCTS
- Red: Llama-3.1-70B: SC-MCTS* (Ours)
- Pink: o1-mini: 4-shot
- Blue: Llama-3.1-405B: 4-shot CoT
- **Right Subplot**:
- Yellow: Llama-3.70B: 4-shot CoT
- Orange: Llama-3.70B: RAP-MCTS
- Red: Llama-3.70B: SC-MCTS* (Ours)
- Pink: o1-mini: 4-shot
- Blue: Llama-3.1-405B: 4-shot CoT
---
### Detailed Analysis
#### Left Subplot (Llama-3.1-70B)
1. **Yellow Line (4-shot CoT)**:
- Starts at ~0.62 (Step 2), drops to ~0.28 (Step 4), then ~0.34 (Step 6), ~0.18 (Step 8), ~0.19 (Step 10), and ~0.15 (Step 12).
- **Trend**: Sharp decline, with a plateau between Steps 8–10.
2. **Orange Line (RAP-MCTS)**:
- Starts at ~0.95 (Step 2), drops to ~0.90 (Step 4), ~0.80 (Step 6), ~0.60 (Step 8), ~0.40 (Step 10), and ~0.10 (Step 12).
- **Trend**: Steep, consistent decline.
3. **Red Line (SC-MCTS*)**:
- Starts at ~0.98 (Step 2), drops to ~0.95 (Step 4), ~0.80 (Step 6), ~0.50 (Step 8), ~0.30 (Step 10), and ~0.20 (Step 12).
- **Trend**: Gradual decline, but steeper than 4-shot CoT.
4. **Pink Line (o1-mini: 4-shot)**:
- Starts at ~0.95 (Step 2), drops to ~0.85 (Step 4), ~0.50 (Step 6), ~0.30 (Step 8), ~0.25 (Step 10), and ~0.15 (Step 12).
- **Trend**: Moderate decline, with a sharp drop between Steps 6–8.
5. **Blue Line (Llama-3.1-405B: 4-shot CoT)**:
- Starts at ~0.90 (Step 2), drops to ~0.68 (Step 4), ~0.66 (Step 6), ~0.58 (Step 8), ~0.55 (Step 10), and ~0.50 (Step 12).
- **Trend**: Gradual, stable decline.
#### Right Subplot (Llama-3.70B)
1. **Yellow Line (4-shot CoT)**:
- Starts at ~0.55 (Step 2), drops to ~0.45 (Step 4), ~0.40 (Step 6), ~0.30 (Step 8), ~0.20 (Step 10), and ~0.15 (Step 12).
- **Trend**: Steeper decline than left subplot.
2. **Orange Line (RAP-MCTS)**:
- Starts at ~0.98 (Step 2), drops to ~0.95 (Step 4), ~0.85 (Step 6), ~0.70 (Step 8), ~0.50 (Step 10), and ~0.20 (Step 12).
- **Trend**: Steep, consistent decline.
3. **Red Line (SC-MCTS*)**:
- Starts at ~0.98 (Step 2), drops to ~0.95 (Step 4), ~0.80 (Step 6), ~0.60 (Step 8), ~0.40 (Step 10), and ~0.20 (Step 12).
- **Trend**: Gradual decline, similar to left subplot.
4. **Pink Line (o1-mini: 4-shot)**:
- Starts at ~0.95 (Step 2), drops to ~0.85 (Step 4), ~0.50 (Step 6), ~0.40 (Step 8), ~0.30 (Step 10), and ~0.20 (Step 12).
- **Trend**: Moderate decline, with a sharp drop between Steps 6–8.
5. **Blue Line (Llama-3.1-405B: 4-shot CoT)**:
- Starts at ~0.90 (Step 2), drops to ~0.70 (Step 4), ~0.65 (Step 6), ~0.55 (Step 8), ~0.50 (Step 10), and ~0.45 (Step 12).
- **Trend**: Gradual, stable decline.
---
### Key Observations
1. **SC-MCTS* (Red Line)**:
- Consistently outperforms other methods in both subplots, though accuracy declines with increasing steps.
- In the left subplot, it maintains higher accuracy than RAP-MCTS and 4-shot CoT.
2. **RAP-MCTS (Orange Line)**:
- Shows the steepest decline in both subplots, suggesting it is highly sensitive to step increases.
3. **4-shot CoT (Yellow/Blue Lines)**:
- Accuracy declines more gradually than RAP-MCTS but less than SC-MCTS*.
- The Llama-3.1-405B variant (blue line) retains higher accuracy than the Llama-3.70B variant (yellow line).
4. **o1-mini (Pink Line)**:
- Performs similarly to 4-shot CoT but with a sharper drop between Steps 6–8.
5. **Model Version Differences**:
- Llama-3.1-70B (left subplot) generally shows higher accuracy than Llama-3.70B (right subplot) for the same methods.
---
### Interpretation
- **Method Effectiveness**: SC-MCTS* (red line) demonstrates the most robust performance across steps, suggesting it is better suited for incremental tasks. RAP-MCTS (orange line) is the least stable, with rapid accuracy degradation.
- **Model Size Impact**: The Llama-3.1-405B variant (blue line) outperforms the Llama-3.70B variant (yellow line) in 4-shot CoT, indicating larger models may handle incremental steps more effectively.
- **Step Sensitivity**: All methods show declining accuracy with increasing steps, but the rate of decline varies. SC-MCTS* and 4-shot CoT exhibit more gradual declines, while RAP-MCTS and o1-mini drop sharply.
- **Anomalies**: The pink line (o1-mini) in the left subplot shows a plateau between Steps 8–10, which may indicate a threshold effect or data inconsistency.
This analysis highlights trade-offs between method robustness and model size, with SC-MCTS* and larger models (Llama-3.1-405B) offering better performance stability.