## Histogram Series: Distribution of Max Progress Steps by Solution Steps
### Overview
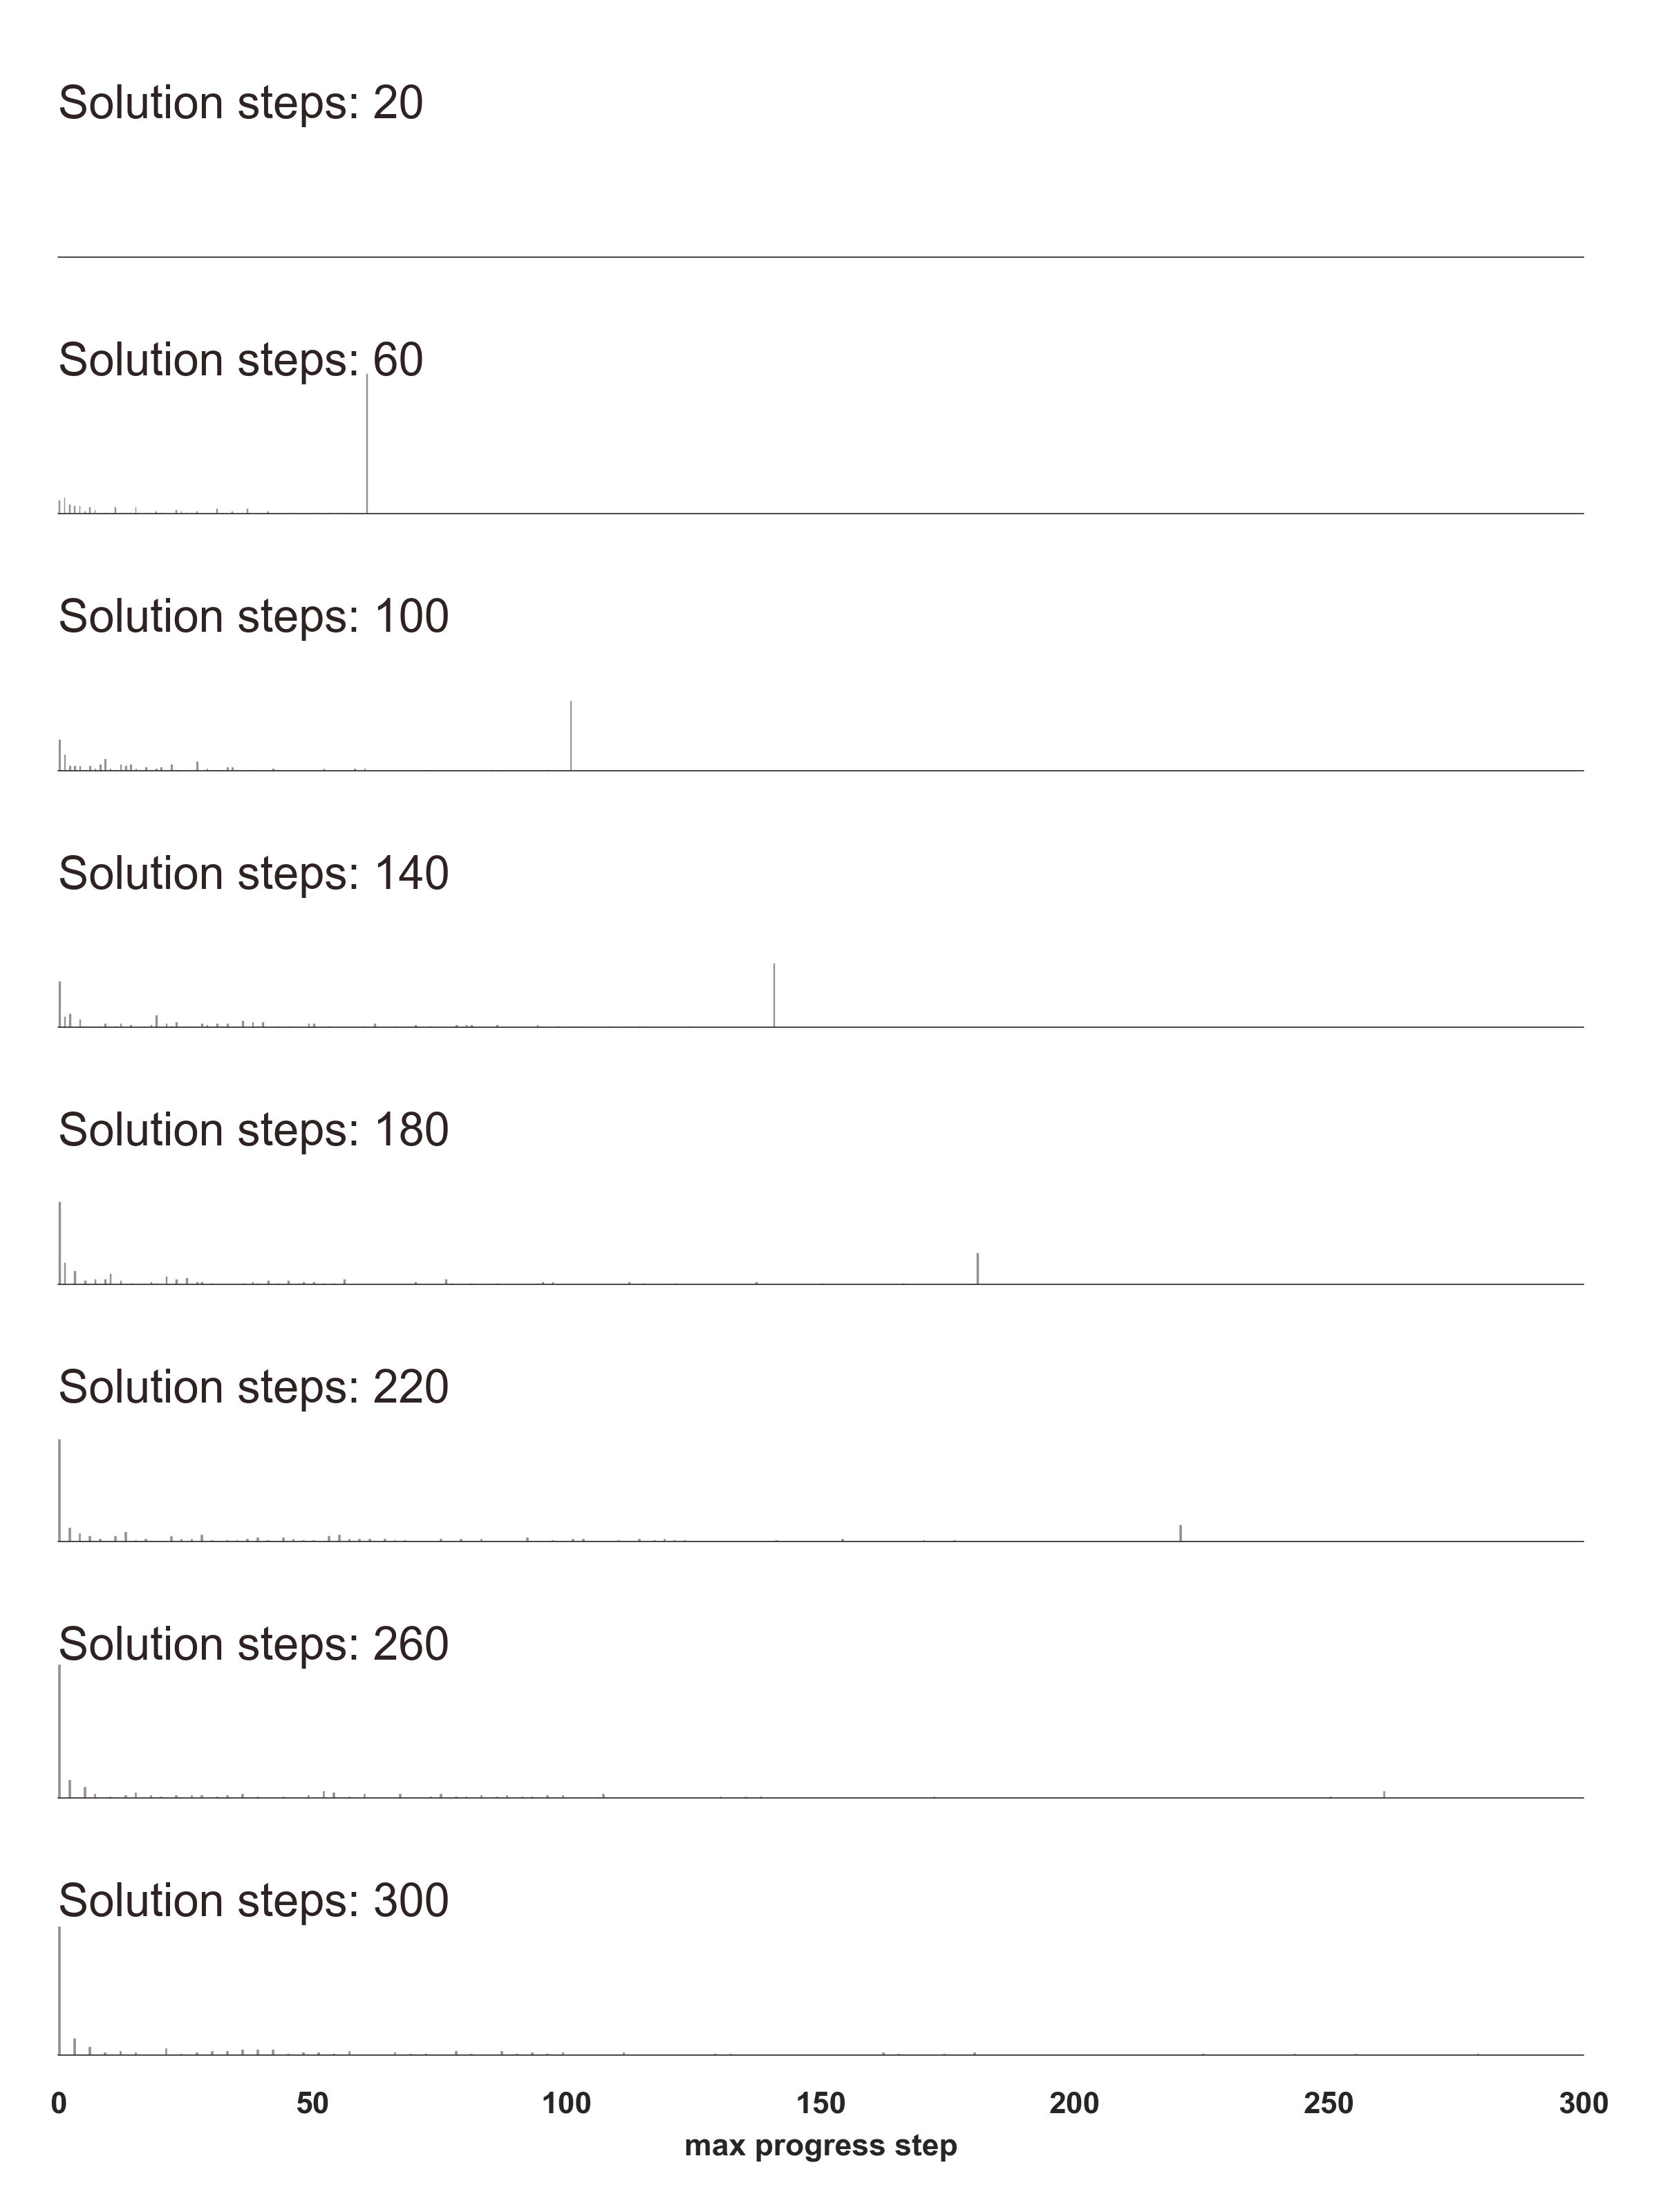
The image displays a series of eight stacked histograms, each representing the distribution of "max progress step" achieved for a specific number of "Solution steps." The charts are aligned vertically, sharing a common x-axis at the bottom. Each histogram is dominated by a single, prominent vertical bar that shifts progressively to the right as the "Solution steps" value increases.
### Components/Axes
* **Vertical Labels:** Located on the left of each histogram row, indicating the "Solution steps" parameter. The values are: 20, 60, 100, 140, 180, 220, 260, and 300.
* **X-Axis:** Located at the bottom of the entire figure, labeled "max progress step." The scale ranges from 0 to 300, with major tick marks at intervals of 50 (0, 50, 100, 150, 200, 250, 300).
* **Y-Axis:** Implicit frequency/count for each histogram. The height of the bars represents the density or count of occurrences at that specific "max progress step."
### Detailed Analysis
Each row represents a distinct dataset. Below is the approximate position of the primary peak (tallest bar) for each "Solution steps" category:
| Solution steps | Primary Peak Position (approx. max progress step) |
| :--- | :--- |
| 20 | ~20 |
| 60 | ~60 |
| 100 | ~100 |
| 140 | ~140 |
| 180 | ~180 |
| 220 | ~220 |
| 260 | ~260 |
| 300 | ~300 |
**Trend Verification:**
* **Primary Trend:** There is a strong, linear positive correlation between the "Solution steps" label and the position of the primary peak on the x-axis. As the label increases, the peak shifts rightward by an equivalent amount.
* **Secondary Trend:** In every row, there is a consistent, smaller cluster of activity located near the 0 mark on the x-axis. This suggests a baseline or "failure" state where the progress step remained near zero regardless of the target solution steps.
### Key Observations
* **High Precision:** The primary peak in every row aligns almost perfectly with the numerical value of the "Solution steps" label.
* **Bimodal Distribution:** Each histogram exhibits a bimodal-like distribution: a very tall, thin spike at the target value, and a small, low-frequency cluster of bars near 0.
* **Consistency:** The height of the primary peak appears relatively consistent across all rows, suggesting that the system successfully reaches the target "Solution steps" with high reliability in the majority of cases.
### Interpretation
This visualization likely represents the performance of an algorithm, agent, or simulation (such as a reinforcement learning agent or a pathfinding process) tasked with reaching a specific progress goal.
* **The "Solution steps" label** acts as the target or constraint for the system.
* **The primary peak** represents the system successfully completing the task and reaching the target progress step. The fact that this peak aligns with the label suggests the system is highly accurate and deterministic in achieving its target.
* **The small cluster near 0** likely represents "failures" or "initial states"—instances where the system failed to make progress or was terminated immediately.
* **Conclusion:** The data demonstrates a highly effective system that consistently achieves the target progress step, with a negligible error rate (represented by the small bars near 0). The system's performance is tightly coupled to the input parameter "Solution steps."