## Scatter Plot: Model Performance on Math Benchmarks
### Overview
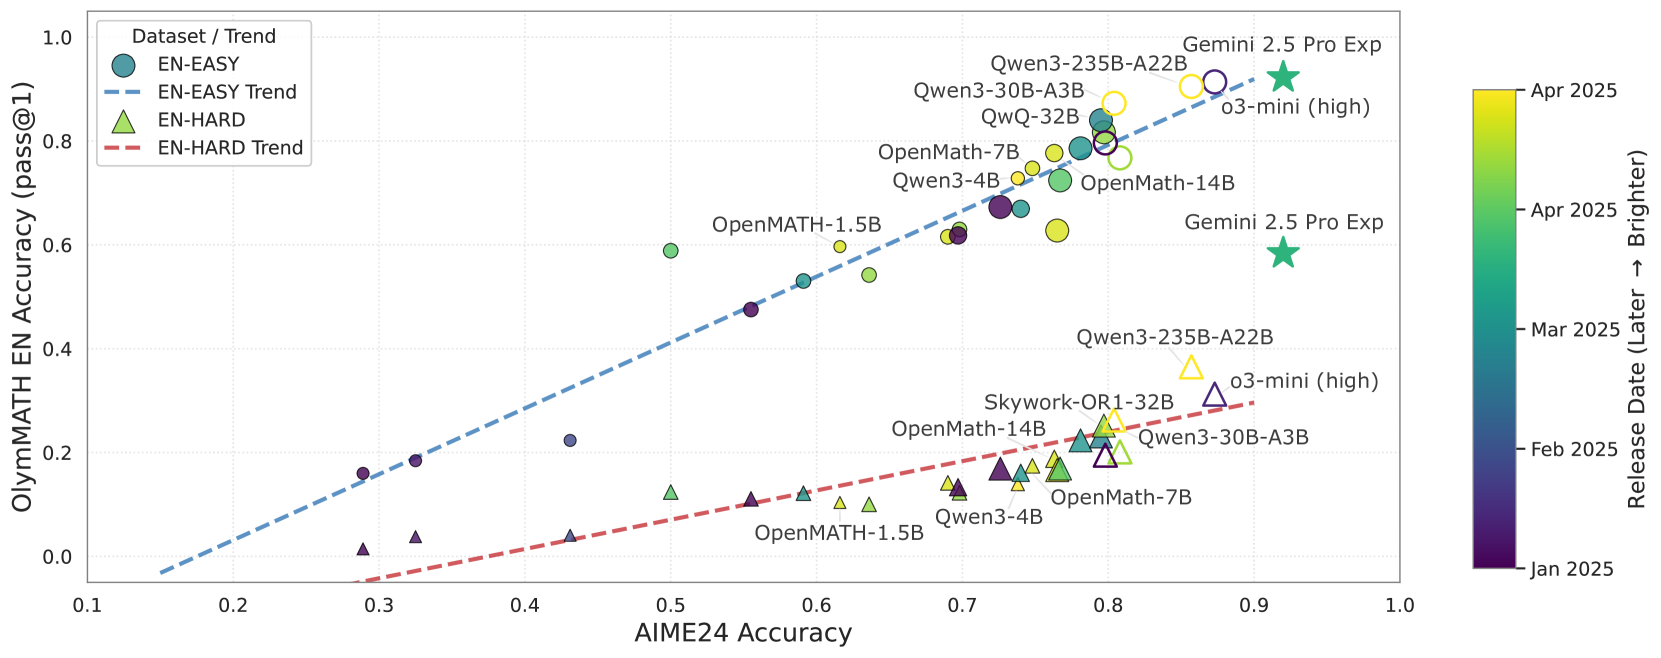
This scatter plot visualizes the performance of various language models on two math benchmarks: AIME24 Accuracy and OlyMath EN Accuracy. The plot also incorporates the release date of each model, represented by color. Four datasets/trends are shown: EN-EASY, EN-EASY Trend, EN-HARD, and EN-HARD Trend.
### Components/Axes
* **X-axis:** AIME24 Accuracy, ranging from approximately 0.1 to 1.0.
* **Y-axis:** OlyMath EN Accuracy (pass@1), ranging from approximately 0.0 to 1.0.
* **Color Scale (Right):** Represents Release Date, ranging from January 2025 (dark purple) to April 2025 (bright green).
* **Legend (Top-Left):**
* **EN-EASY (Blue Circles):** Represents models evaluated on the EN-EASY dataset.
* **EN-EASY Trend (Blue Dashed Line):** Represents the trend line for the EN-EASY dataset.
* **EN-HARD (Red Triangles):** Represents models evaluated on the EN-HARD dataset.
* **EN-HARD Trend (Red Dashed Line):** Represents the trend line for the EN-HARD dataset.
* **Data Points:** Each point represents a specific model, labeled with its name.
### Detailed Analysis
**EN-EASY Dataset (Blue Circles):**
The EN-EASY data points generally show a positive correlation between AIME24 Accuracy and OlyMath EN Accuracy. The data points are scattered, but a clear upward trend is visible.
* Qwen3-235B-A22B: (Approx. 0.95, 0.75) - Released around March 2025 (light green).
* Qwen3-30B-A3B: (Approx. 0.85, 0.65) - Released around February 2025 (medium purple).
* QwQ-32B: (Approx. 0.75, 0.55) - Released around February 2025 (medium purple).
* OpenMath-7B: (Approx. 0.7, 0.4) - Released around January 2025 (dark purple).
* Qwen3-4B: (Approx. 0.6, 0.3) - Released around January 2025 (dark purple).
* OpenMath-14B: (Approx. 0.78, 0.58) - Released around February 2025 (medium purple).
* OpenMath-1.5B: (Approx. 0.5, 0.2) - Released around January 2025 (dark purple).
* Gemini 2.5 Pro Exp: (Approx. 0.98, 0.8) - Released around April 2025 (bright green).
**EN-EASY Trend (Blue Dashed Line):**
The EN-EASY trend line slopes upward, indicating a positive correlation. It starts at approximately (0.2, 0.05) and ends at approximately (0.95, 0.75).
**EN-HARD Dataset (Red Triangles):**
The EN-HARD data points also show a positive correlation, but the relationship appears weaker than for the EN-EASY dataset. The points are more scattered.
* Qwen3-235B-A22B: (Approx. 0.9, 0.1) - Released around March 2025 (light green).
* Qwen3-30B-A3B: (Approx. 0.8, 0.05) - Released around February 2025 (medium purple).
* Skywork-OR1-32B: (Approx. 0.75, 0.08) - Released around February 2025 (medium purple).
* OpenMath-14B: (Approx. 0.7, 0.06) - Released around February 2025 (medium purple).
* OpenMath-7B: (Approx. 0.65, 0.04) - Released around January 2025 (dark purple).
* OpenMath-1.5B: (Approx. 0.4, 0.02) - Released around January 2025 (dark purple).
* o3-mini (high): (Approx. 0.95, 0.15) - Released around March 2025 (light green).
* o3-mini (high): (Approx. 0.85, 0.1) - Released around February 2025 (medium purple).
**EN-HARD Trend (Red Dashed Line):**
The EN-HARD trend line also slopes upward, but is flatter than the EN-EASY trend line. It starts at approximately (0.2, 0.0) and ends at approximately (0.9, 0.1).
### Key Observations
* Models released later (indicated by greener colors) generally exhibit higher performance on both benchmarks.
* The EN-EASY dataset shows a stronger correlation between AIME24 and OlyMath EN accuracy than the EN-HARD dataset.
* Gemini 2.5 Pro Exp appears to be the highest-performing model on both benchmarks.
* There is a noticeable gap in performance between the EN-EASY and EN-HARD datasets, with EN-EASY models consistently outperforming EN-HARD models.
### Interpretation
The data suggests that as models become more advanced (as indicated by later release dates and larger model sizes), their performance on math benchmarks improves. The distinction between the EN-EASY and EN-HARD datasets indicates that the difficulty of the math problems significantly impacts performance. The stronger correlation within the EN-EASY dataset suggests that models are more consistent in their ability to solve easier math problems. The outliers, such as the models with high AIME24 accuracy but relatively low OlyMath EN accuracy, may indicate specialization in certain types of math problems. The color gradient provides a valuable temporal dimension, allowing for the observation of performance improvements over time. The dashed trend lines provide a generalized view of the relationship between the two benchmarks for each dataset, while the individual data points reveal the specific performance of each model. The positioning of the models on the chart allows for a direct comparison of their strengths and weaknesses across the two benchmarks.