TECHNICAL ASSET FINGERPRINT
5f6f7df85dddfafaee3b672f
Click to view fullscreen
Press ESC or click to close
FOUND IN PAPERS
EXPERT: healer-alpha-free VERSION 1
RUNTIME: free/openrouter/healer-alpha
INTEL_VERIFIED
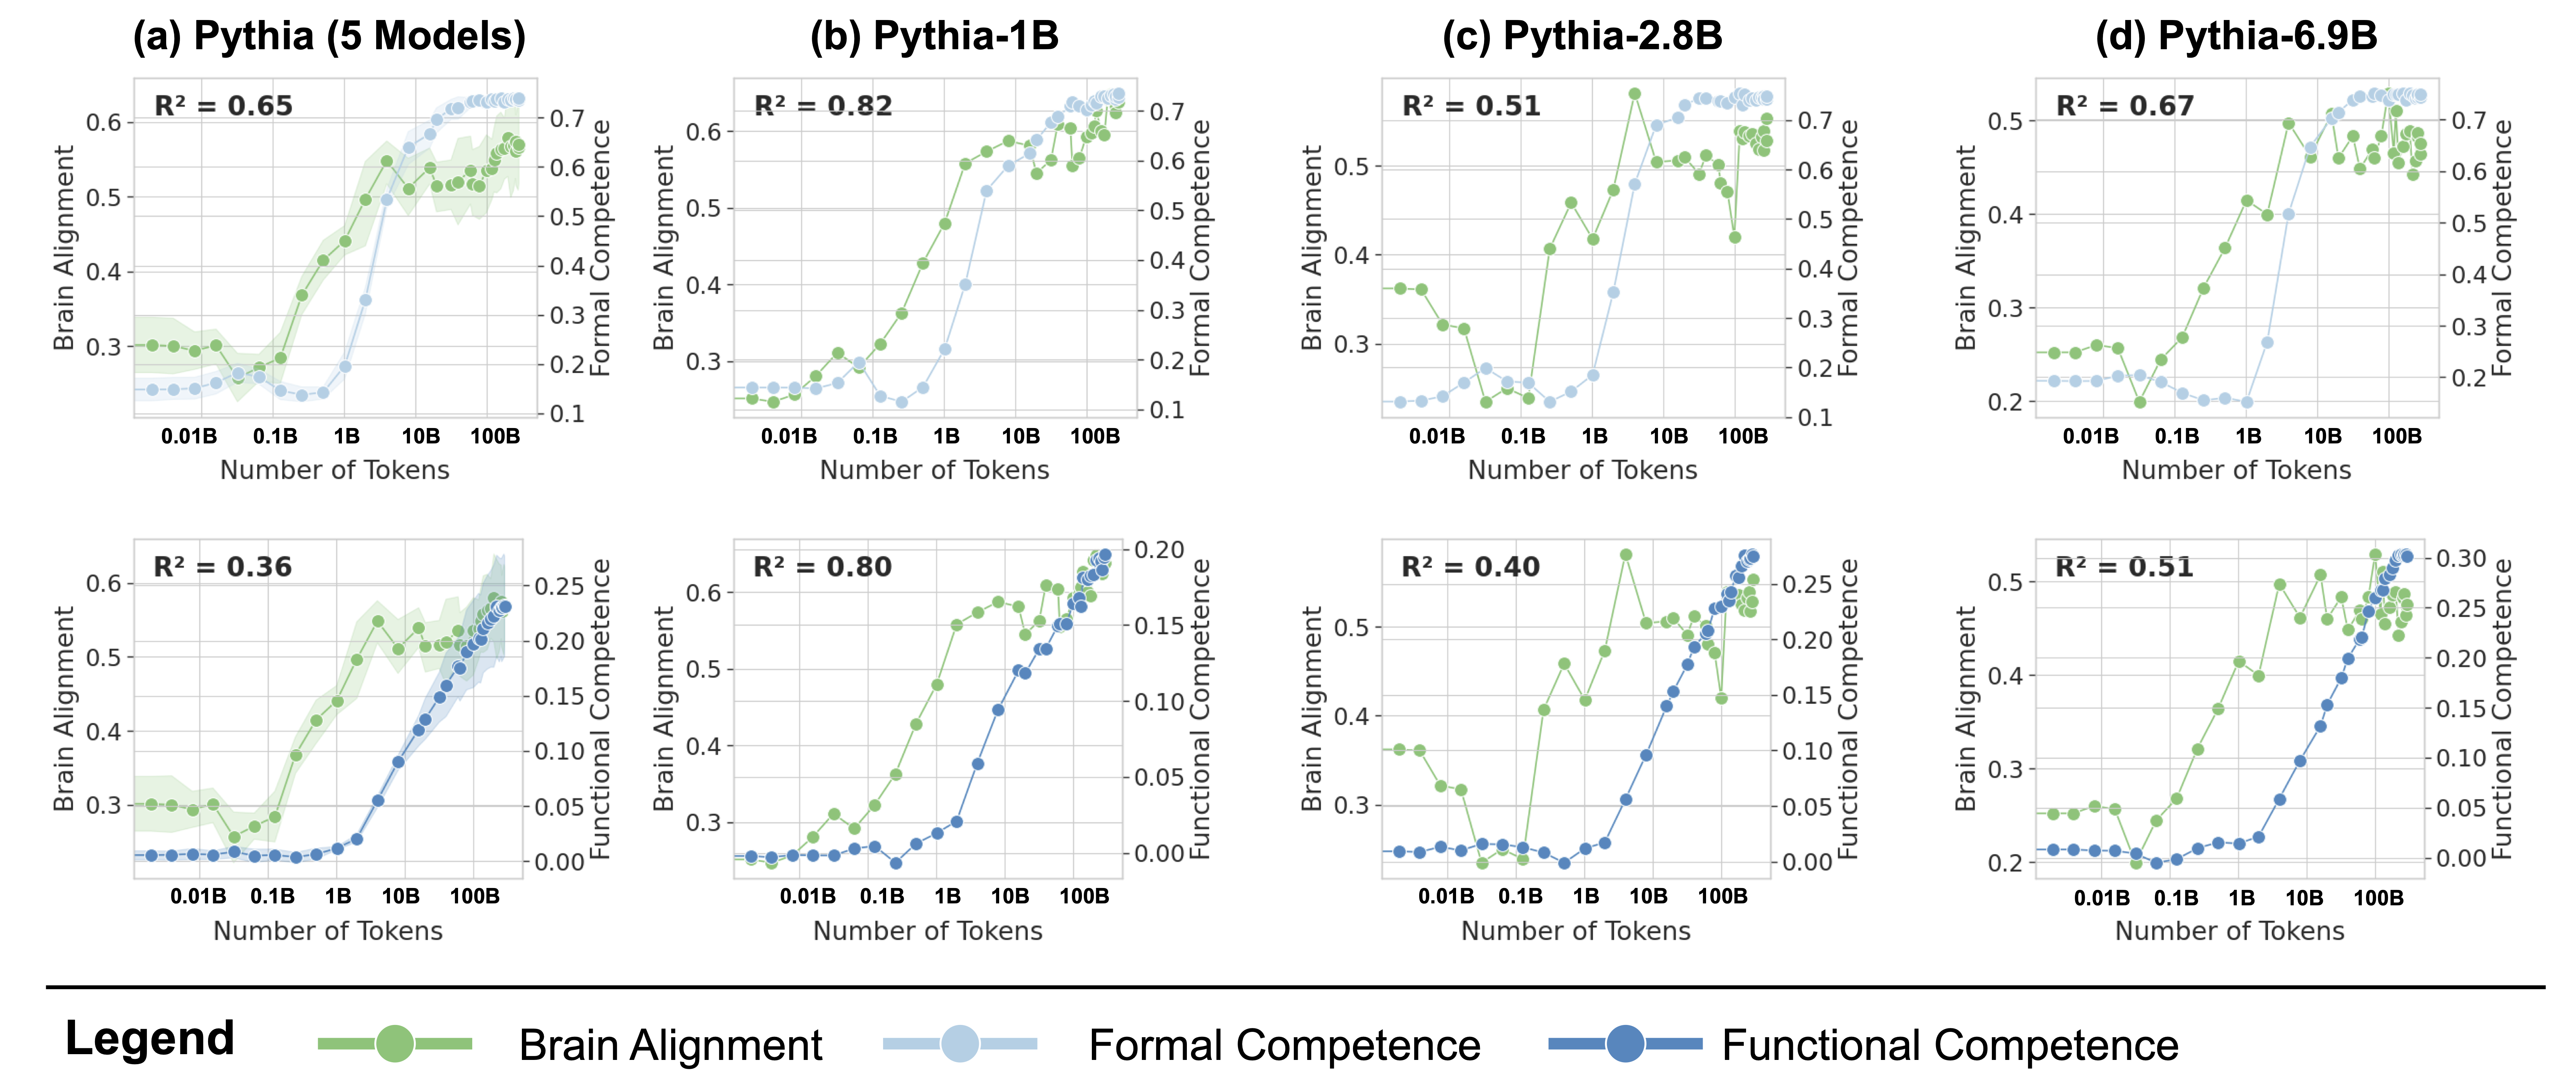
## [Multi-Panel Scatter Plot]: Scaling Trends of Pythia Models
### Overview
The image displays a 2x4 grid of eight scatter plots, analyzing the relationship between training data size ("Number of Tokens") and three key metrics for different sizes of the Pythia language model family. The top row compares "Brain Alignment" with "Formal Competence," while the bottom row compares "Brain Alignment" with "Functional Competence." Each column represents a different model or model group: (a) Pythia (5 Models), (b) Pythia-1B, (c) Pythia-2.8B, and (d) Pythia-6.9B.
### Components/Axes
* **Common X-Axis (All Plots):** "Number of Tokens" on a logarithmic scale. Major tick marks are at 0.01B, 0.1B, 1B, 10B, and 100B (where B = Billion).
* **Common Left Y-Axis (All Plots):** "Brain Alignment," with a scale ranging from approximately 0.2 to 0.6 or 0.7, depending on the plot.
* **Right Y-Axis (Top Row):** "Formal Competence," with a scale from 0.1 to 0.7.
* **Right Y-Axis (Bottom Row):** "Functional Competence," with a scale from 0.00 to 0.30.
* **Legend (Bottom of Image):**
* **Green line with circle markers:** "Brain Alignment"
* **Light blue line with circle markers:** "Formal Competence"
* **Dark blue line with circle markers:** "Functional Competence"
* **Plot Titles:**
* (a) Pythia (5 Models)
* (b) Pythia-1B
* (c) Pythia-2.8B
* (d) Pythia-6.9B
* **Statistical Annotation (Top-left of each plot):** An R² value indicating the goodness of fit for the relationship between the two plotted metrics.
### Detailed Analysis
**Row 1: Brain Alignment vs. Formal Competence**
* **(a) Pythia (5 Models):**
* **R² = 0.65**
* **Brain Alignment (Green):** Shows a general upward trend from ~0.3 at 0.01B tokens to ~0.55 at 100B tokens. The trend is noisy, with a notable dip around 0.1B tokens. A shaded green area indicates variance or confidence interval.
* **Formal Competence (Light Blue):** Shows a strong, smooth upward trend from ~0.15 at 0.01B tokens to ~0.7 at 100B tokens.
* **(b) Pythia-1B:**
* **R² = 0.82** (Highest in the top row)
* **Brain Alignment (Green):** Increases steadily from ~0.25 at 0.01B tokens to a peak of ~0.6 at 100B tokens.
* **Formal Competence (Light Blue):** Follows a very similar, smooth upward trajectory to Brain Alignment, rising from ~0.15 to ~0.7.
* **(c) Pythia-2.8B:**
* **R² = 0.51**
* **Brain Alignment (Green):** Exhibits high volatility. Starts at ~0.35, dips to ~0.2 at 0.1B tokens, spikes to a peak of ~0.65 at ~5B tokens, then fluctuates between 0.5 and 0.6 at higher token counts.
* **Formal Competence (Light Blue):** Shows a consistent, smooth increase from ~0.15 to ~0.7.
* **(d) Pythia-6.9B:**
* **R² = 0.67**
* **Brain Alignment (Green):** Trends upward from ~0.25 to ~0.5, with a significant dip around 0.1B tokens.
* **Formal Competence (Light Blue):** Smooth upward trend from ~0.2 to ~0.7.
**Row 2: Brain Alignment vs. Functional Competence**
* **(a) Pythia (5 Models):**
* **R² = 0.36** (Lowest in the entire figure)
* **Brain Alignment (Green):** Same noisy upward trend as in the plot above.
* **Functional Competence (Dark Blue):** Shows a very gradual, shallow increase from ~0.00 at 0.01B tokens to only ~0.25 at 100B tokens. The relationship with Brain Alignment is weak.
* **(b) Pythia-1B:**
* **R² = 0.80**
* **Brain Alignment (Green):** Steady increase as seen above.
* **Functional Competence (Dark Blue):** Shows a strong, smooth upward trend from ~0.00 to ~0.20, closely tracking Brain Alignment.
* **(c) Pythia-2.8B:**
* **R² = 0.40**
* **Brain Alignment (Green):** Same volatile pattern as above.
* **Functional Competence (Dark Blue):** Increases smoothly from ~0.00 to ~0.25, but does not follow the sharp peaks and dips of Brain Alignment.
* **(d) Pythia-6.9B:**
* **R² = 0.51**
* **Brain Alignment (Green):** Upward trend with a dip.
* **Functional Competence (Dark Blue):** Smooth increase from ~0.00 to ~0.30.
### Key Observations
1. **Consistent Growth of Competence Metrics:** Both Formal Competence (light blue) and Functional Competence (dark blue) show smooth, monotonic increases with more training tokens across all model sizes.
2. **Volatility of Brain Alignment:** Brain Alignment (green) is far noisier and less predictable than the competence metrics. It often shows dips (e.g., around 0.1B tokens in several plots) and spikes that are not reflected in the competence curves.
3. **Model-Specific Correlation:** The correlation (R²) between Brain Alignment and the competence metrics varies significantly by model. Pythia-1B shows the strongest correlation (R² ~0.8), while the aggregated "5 Models" plot and Pythia-2.8B show much weaker correlations, especially for Functional Competence.
4. **Scale of Metrics:** Formal Competence reaches much higher absolute values (~0.7) compared to Functional Competence (~0.2-0.3), suggesting they measure different aspects of model capability.
### Interpretation
This data suggests a complex relationship between how a language model's internal representations align with human brain activity ("Brain Alignment") and its measurable capabilities ("Competence").
* **Competence is a Reliable Function of Scale:** The smooth, predictable growth of Formal and Functional Competence confirms a core tenet of scaling laws: more training data reliably improves benchmark performance.
* **Brain Alignment is Not a Simple Proxy for Competence:** The high volatility and weaker correlation of Brain Alignment indicate it is not merely a reflection of general capability. The dips (e.g., at 0.1B tokens) may represent phases in training where the model's internal organization is undergoing restructuring, temporarily diverging from brain-like patterns even as competence slowly grows.
* **Model Size Matters:** The differing R² values across model sizes (1B, 2.8B, 6.9B) imply that the relationship between brain-like processing and functional skills is not uniform. Smaller models (1B) may develop these traits in a more coupled manner, while larger models might decouple them, potentially developing competence through different internal pathways.
* **Two Types of Competence:** The stark difference in scale and trend smoothness between Formal and Functional Competence suggests they capture distinct dimensions of model ability. Formal Competence may relate to structured, rule-based tasks, while Functional Competence could measure more pragmatic or applied skills.
In summary, the figure argues that while training scale reliably drives up model competence, the emergence of brain-like representational alignment is a more erratic and model-size-dependent phenomenon that does not simply track capability gains.
DECODING INTELLIGENCE...