## Chart: Test Loss vs. Parameters with Reuse
### Overview
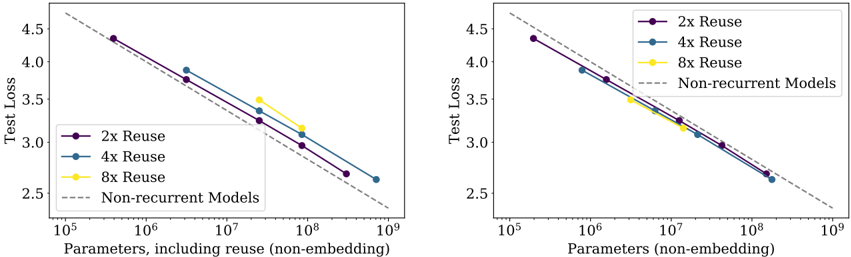
The image presents two identical line charts comparing the test loss of machine learning models with different levels of parameter reuse against non-recurrent models. Both charts plot "Test Loss" on the y-axis against "Parameters, including reuse (non-embedding)" on the x-axis, using a logarithmic scale for the x-axis. The charts aim to demonstrate the impact of parameter reuse on model performance as the number of parameters increases.
### Components/Axes
* **X-axis Title:** "Parameters, including reuse (non-embedding)" - Scale is logarithmic, ranging from 10<sup>5</sup> to 10<sup>9</sup>.
* **Y-axis Title:** "Test Loss" - Scale ranges from 2.5 to 4.5.
* **Legend:** Located in the top-right corner of each chart.
* "2x Reuse" - Purple line with circular markers.
* "4x Reuse" - Blue line with circular markers.
* "8x Reuse" - Yellow line with circular markers.
* "Non-recurrent Models" - Brown dashed line.
* **Data Series:** Four lines representing different reuse configurations and non-recurrent models.
* **Gridlines:** Dashed grey lines providing visual reference.
### Detailed Analysis or Content Details
**Chart 1 (Left):**
* **2x Reuse (Purple):** The line slopes downward consistently. Approximate data points:
* (10<sup>5</sup>, ~4.3)
* (10<sup>6</sup>, ~3.9)
* (10<sup>7</sup>, ~3.4)
* (10<sup>8</sup>, ~3.0)
* (10<sup>9</sup>, ~2.6)
* **4x Reuse (Blue):** The line slopes downward consistently, slightly steeper than the 2x Reuse line. Approximate data points:
* (10<sup>5</sup>, ~4.3)
* (10<sup>6</sup>, ~3.7)
* (10<sup>7</sup>, ~3.2)
* (10<sup>8</sup>, ~2.8)
* (10<sup>9</sup>, ~2.4)
* **8x Reuse (Yellow):** The line initially slopes downward, but flattens out between 10<sup>7</sup> and 10<sup>8</sup>. Approximate data points:
* (10<sup>5</sup>, ~4.3)
* (10<sup>6</sup>, ~3.6)
* (10<sup>7</sup>, ~3.4)
* (10<sup>8</sup>, ~3.2)
* (10<sup>9</sup>, ~3.0)
* **Non-recurrent Models (Brown Dashed):** The line slopes downward consistently, but is less steep than the 2x and 4x Reuse lines. Approximate data points:
* (10<sup>5</sup>, ~4.4)
* (10<sup>6</sup>, ~4.0)
* (10<sup>7</sup>, ~3.6)
* (10<sup>8</sup>, ~3.2)
* (10<sup>9</sup>, ~2.8)
**Chart 2 (Right):**
* **2x Reuse (Purple):** The line slopes downward consistently. Approximate data points:
* (10<sup>5</sup>, ~4.4)
* (10<sup>6</sup>, ~4.0)
* (10<sup>7</sup>, ~3.5)
* (10<sup>8</sup>, ~3.0)
* (10<sup>9</sup>, ~2.6)
* **4x Reuse (Blue):** The line slopes downward consistently, slightly steeper than the 2x Reuse line. Approximate data points:
* (10<sup>5</sup>, ~4.4)
* (10<sup>6</sup>, ~3.8)
* (10<sup>7</sup>, ~3.3)
* (10<sup>8</sup>, ~2.8)
* (10<sup>9</sup>, ~2.4)
* **8x Reuse (Yellow):** The line initially slopes downward, but flattens out between 10<sup>7</sup> and 10<sup>8</sup>. Approximate data points:
* (10<sup>5</sup>, ~4.4)
* (10<sup>6</sup>, ~3.7)
* (10<sup>7</sup>, ~3.4)
* (10<sup>8</sup>, ~3.2)
* (10<sup>9</sup>, ~3.0)
* **Non-recurrent Models (Brown Dashed):** The line slopes downward consistently, but is less steep than the 2x and 4x Reuse lines. Approximate data points:
* (10<sup>5</sup>, ~4.5)
* (10<sup>6</sup>, ~4.1)
* (10<sup>7</sup>, ~3.7)
* (10<sup>8</sup>, ~3.3)
* (10<sup>9</sup>, ~2.9)
### Key Observations
* Parameter reuse generally leads to lower test loss compared to non-recurrent models.
* Increasing the reuse factor (from 2x to 4x) consistently improves performance.
* The benefit of 8x reuse appears to diminish at higher parameter counts (around 10<sup>7</sup> - 10<sup>8</sup>), where its performance plateaus.
* Both charts show very similar trends, suggesting the results are consistent.
### Interpretation
The charts demonstrate the effectiveness of parameter reuse in reducing test loss for machine learning models. The steeper slopes of the 2x and 4x reuse lines indicate that increasing the number of parameters while reusing them leads to more significant performance gains than simply increasing parameters without reuse (as seen in the non-recurrent models). The flattening of the 8x reuse line suggests a point of diminishing returns, where further increasing reuse does not yield substantial improvements. This could be due to factors like overfitting or limitations in the model architecture. The consistency between the two charts strengthens the validity of these observations. The logarithmic scale on the x-axis highlights the impact of parameter scaling, particularly at larger parameter counts. The data suggests that parameter reuse is a valuable technique for improving model performance, but careful consideration should be given to the optimal reuse factor and the potential for diminishing returns.