\n
## Diagram: Spatial Audio Processing Pipeline
### Overview
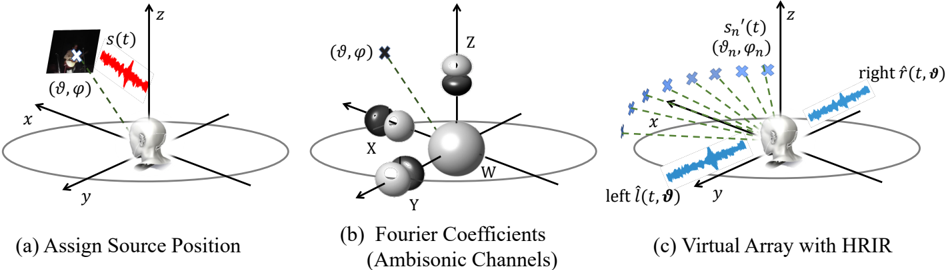
The image depicts a three-part diagram illustrating a spatial audio processing pipeline. It shows how a sound source position is translated into ambisonic coefficients and then into signals for a virtual array of speakers using Head-Related Impulse Responses (HRIRs). Each part of the diagram is labeled (a), (b), and (c) and has a descriptive title.
### Components/Axes
Each sub-diagram features a 3D Cartesian coordinate system (x, y, z). The diagrams also include the following labels:
* **(a) Assign Source Position:** Labels include 's(t)' representing the sound source, 'x', 'y', 'z' for the coordinate axes, and 'θ, φ' representing spherical coordinates. A small inset image shows a waveform with a crosshair indicating a source location.
* **(b) Fourier Coefficients (Ambisonic Channels):** Labels include 'θ, φ' representing spherical coordinates, 'w' representing a central ambisonic channel, and 'x', 'y', 'z' for the coordinate axes. Black and white spheres represent ambisonic channels.
* **(c) Virtual Array with HRIR:** Labels include 'sn(t)' and '(vn, φn)' representing the nth virtual source, 'right f(t, θ)' and 'left f(t, θ)' representing the output signals for the right and left channels, 'x', 'y', 'z' for the coordinate axes. Blue waveforms represent the signals, and green dashed lines represent HRIRs.
### Detailed Analysis or Content Details
**(a) Assign Source Position:**
This diagram shows a sound source 's(t)' positioned in 3D space defined by Cartesian coordinates (x, y, z) and spherical coordinates (θ, φ). The inset image shows a waveform with a cross indicating the source location. The waveform appears to be a short burst or transient signal.
**(b) Fourier Coefficients (Ambisonic Channels):**
This diagram illustrates the decomposition of the sound source into a set of ambisonic coefficients. A central white sphere labeled 'w' represents the W channel (omnidirectional). Surrounding it are black and white spheres representing other ambisonic channels. Dashed lines connect the source position (θ, φ) to each of these spheres, indicating the calculation of the coefficients. The spheres are positioned along the x, y, and z axes.
**(c) Virtual Array with HRIR:**
This diagram depicts the final stage of the pipeline, where the ambisonic coefficients are used to drive a virtual array of speakers. The nth virtual source 'sn(t)' is defined by coordinates (vn, φn). Green dashed lines represent Head-Related Impulse Responses (HRIRs) that convolve with the ambisonic signals to create binaural signals for the left and right channels: 'left f(t, θ)' and 'right f(t, θ)'. Blue waveforms represent the output signals for the left and right channels. The waveforms appear to be complex and varied, suggesting the effect of the HRIRs.
### Key Observations
* The pipeline progresses from a single sound source to a representation in the ambisonic domain and finally to binaural signals for playback.
* The use of spherical coordinates (θ, φ) is consistent throughout the diagram, indicating their importance in representing sound source location.
* HRIRs are crucial for creating the spatial impression by accounting for the listener's head and ear shape.
* The ambisonic representation allows for efficient encoding and decoding of spatial audio.
### Interpretation
This diagram illustrates a common approach to spatial audio rendering. The process begins by defining the location of a sound source in 3D space. This location is then used to calculate a set of ambisonic coefficients, which represent the sound field. Finally, these coefficients are convolved with HRIRs to create binaural signals that can be played back over headphones or speakers to create a realistic spatial experience. The diagram highlights the key steps involved in this process and the importance of each component. The use of ambisonics allows for a compact and efficient representation of the sound field, while HRIRs provide the necessary cues for localization. The diagram suggests a system designed for virtual or augmented reality applications where accurate spatial audio is critical for immersion. The diagram does not provide any numerical data, but rather a conceptual overview of the process.