\n
## Line Chart: Per-Period Regret vs. Time Period
### Overview
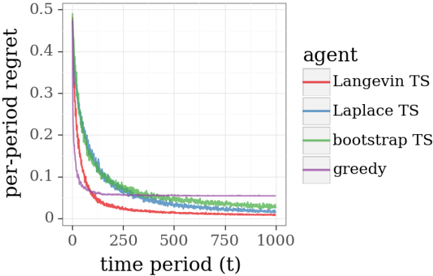
The image presents a line chart illustrating the per-period regret of different agents over a time period of 1000 units. The chart compares the performance of four agents: Langevin TS, Laplace TS, bootstrap TS, and greedy. The y-axis represents the per-period regret, while the x-axis represents the time period (t).
### Components/Axes
* **X-axis:** "time period (t)", ranging from approximately 0 to 1000.
* **Y-axis:** "per-period regret", ranging from approximately 0 to 0.5.
* **Legend (top-right):**
* Langevin TS (Red)
* Laplace TS (Gray)
* bootstrap TS (Green)
* greedy (Purple)
### Detailed Analysis
The chart displays four distinct lines, each representing an agent's per-period regret over time.
* **Langevin TS (Red):** The line starts at approximately 0.45 at t=0 and rapidly decreases to around 0.07 by t=250. It continues to decrease slowly, reaching approximately 0.055 by t=1000.
* **Laplace TS (Gray):** The line begins at approximately 0.35 at t=0 and decreases more gradually than Langevin TS, reaching around 0.065 by t=250. It continues to decrease, leveling off around 0.05 by t=1000.
* **bootstrap TS (Green):** The line starts at approximately 0.3 at t=0 and decreases at a rate similar to Laplace TS, reaching around 0.06 by t=250. It continues to decrease, leveling off around 0.05 by t=1000.
* **greedy (Purple):** The line begins at approximately 0.25 at t=0 and decreases rapidly, reaching around 0.06 by t=250. It continues to decrease, leveling off around 0.05 by t=1000.
All lines exhibit a decreasing trend, indicating that the per-period regret decreases as the time period increases. The initial decrease is more pronounced for Langevin TS and greedy, while Laplace TS and bootstrap TS show a more gradual decline. All lines converge towards a similar level of per-period regret around t=1000.
### Key Observations
* Langevin TS initially exhibits the highest per-period regret but also the fastest initial decrease.
* The greedy agent starts with the lowest per-period regret but its decrease is not as rapid as Langevin TS.
* Laplace TS and bootstrap TS show similar performance throughout the time period.
* All agents converge to a similar per-period regret level around t=1000, suggesting they achieve comparable performance in the long run.
### Interpretation
The chart demonstrates the learning process of different agents in a sequential decision-making environment. The per-period regret represents the loss incurred by not choosing the optimal action at each time step. The decreasing trend indicates that the agents are learning from their experiences and improving their decision-making over time.
The initial differences in per-period regret likely reflect the exploration-exploitation trade-off of each agent. Langevin TS and greedy may prioritize exploration initially, leading to higher regret but faster learning. Laplace TS and bootstrap TS may prioritize exploitation, leading to lower initial regret but slower learning.
The convergence of the lines towards the end of the time period suggests that all agents eventually achieve a similar level of performance, indicating that they have effectively learned the optimal strategy. The fact that all agents converge to a non-zero regret level suggests that there may be inherent uncertainty or complexity in the environment that prevents them from achieving perfect performance.