\n
## Diagram: Decay Schemes
### Overview
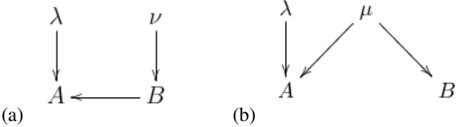
The image presents two diagrams, labeled (a) and (b), illustrating decay schemes. Both diagrams depict transitions between energy levels or particles, represented by letters and arrows. The diagrams appear to represent nuclear or particle physics decay processes.
### Components/Axes
The diagrams consist of the following components:
* **Labels:** λ (lambda), ν (nu), μ (mu), A, B.
* **Arrows:** Represent transitions or decays. The arrows indicate the direction of the decay process.
* **Diagram (a):** Shows a sequential decay where λ decays to A, ν decays to A, and A decays to B.
* **Diagram (b):** Shows a branching decay where λ decays to A, μ decays to B, and both A and B are reached from a common starting point.
### Detailed Analysis or Content Details
**Diagram (a):**
* λ decays to A.
* ν decays to A.
* A decays to B.
* The arrow between A and B is bidirectional, suggesting a reversible process or an equilibrium.
**Diagram (b):**
* λ decays to A.
* μ decays to B.
* A and B are terminal states.
* The arrows from λ to A and μ to B indicate direct decays.
### Key Observations
* Diagram (a) represents a cascade decay, where one particle decays into another, which then decays further.
* Diagram (b) represents a branching decay, where a particle can decay into one of two possible states.
* The symbols λ, ν, and μ likely represent different decay modes or particles involved in the decay process.
* A and B likely represent different energy levels or final states.
### Interpretation
These diagrams illustrate fundamental concepts in decay processes, commonly encountered in nuclear physics and particle physics. Diagram (a) shows a sequential decay, where a particle undergoes multiple decay steps. Diagram (b) shows a branching decay, where a particle has multiple possible decay pathways. The use of Greek letters (λ, ν, μ) suggests these represent specific decay constants or particles. The letters A and B likely represent different states or isotopes. The diagrams are simplified representations of complex physical processes, focusing on the transitions between states rather than the details of the decay mechanisms. The bidirectional arrow in diagram (a) could indicate an equilibrium between A and B, or a reversible process. Without further context, it is difficult to determine the specific physical system being represented.