\n
## Scatter Plot: Confidence vs. Target Length (International Law)
### Overview
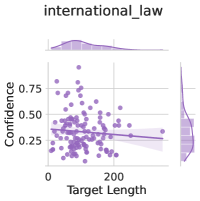
This image presents a scatter plot visualizing the relationship between "Target Length" and "Confidence" for the category "international_law". A regression line with a shaded confidence interval is overlaid on the scatter points. Marginal distributions (density plots) are shown above and to the right of the main scatter plot.
### Components/Axes
* **X-axis:** "Target Length" - Scale ranges from approximately 0 to 300.
* **Y-axis:** "Confidence" - Scale ranges from approximately 0.15 to 0.85.
* **Title:** "international\_law" - Located at the top-center of the image.
* **Scatter Points:** Purple dots representing individual data points.
* **Regression Line:** A dark purple line representing the trend in the data.
* **Confidence Interval:** A light purple shaded area around the regression line, indicating the uncertainty in the estimated trend.
* **Marginal Distribution (Top):** A density plot showing the distribution of "Target Length".
* **Marginal Distribution (Right):** A density plot showing the distribution of "Confidence".
### Detailed Analysis
The scatter plot shows a generally negative trend between "Target Length" and "Confidence". As "Target Length" increases, "Confidence" tends to decrease, although the relationship appears weak and scattered.
* **Regression Line Trend:** The regression line has a slight negative slope, confirming the observed negative trend.
* **Data Point Distribution:** The data points are widely dispersed, indicating a low correlation between the two variables.
* **Target Length Distribution:** The distribution of "Target Length" is skewed to the right, with a peak around 50-100 and a tail extending to 300.
* **Confidence Distribution:** The distribution of "Confidence" is roughly bell-shaped, peaking around 0.35-0.45.
Approximate Data Points (sampled for illustration, not exhaustive):
* Target Length = 0, Confidence ≈ 0.30
* Target Length = 50, Confidence ≈ 0.50
* Target Length = 100, Confidence ≈ 0.40
* Target Length = 150, Confidence ≈ 0.35
* Target Length = 200, Confidence ≈ 0.25
* Target Length = 250, Confidence ≈ 0.20
* Target Length = 300, Confidence ≈ 0.15
### Key Observations
* The correlation between "Target Length" and "Confidence" is weak.
* There is a noticeable spread in the data, suggesting other factors influence "Confidence" besides "Target Length".
* The marginal distributions provide insights into the individual distributions of each variable.
### Interpretation
The data suggests that, for the category "international\_law", longer target lengths are weakly associated with lower confidence scores. However, this relationship is not strong, and there is considerable variability in the data. This could indicate that the length of the target is not a primary determinant of confidence, or that other variables are playing a significant role. The marginal distributions show that target lengths are generally shorter, and confidence scores are relatively low, but there is a range of values for both variables. The weak correlation and wide spread of data points suggest that a more complex model might be needed to accurately predict confidence based on target length. The data does not provide any information about the nature of the "target" or the method used to calculate "confidence".