## Line Chart: Test Loss vs. Parameters (excl. embedding)
### Overview
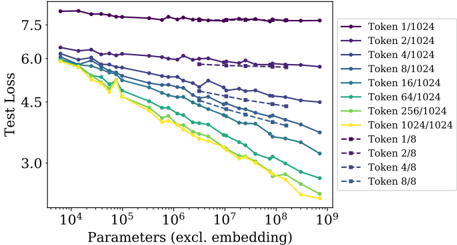
This image presents a line chart illustrating the relationship between "Test Loss" and "Parameters (excl. embedding)" for various "Token" configurations. The chart displays how test loss changes as the number of parameters increases, with different lines representing different token sizes.
### Components/Axes
* **X-axis:** "Parameters (excl. embedding)" - Logarithmic scale, ranging from approximately 10<sup>4</sup> to 10<sup>9</sup>.
* **Y-axis:** "Test Loss" - Linear scale, ranging from approximately 3.0 to 7.5.
* **Legend:** Located in the top-right corner, listing the following data series:
* Token 1/1024 (Purple)
* Token 2/1024 (Dark Blue)
* Token 4/1024 (Light Blue)
* Token 8/1024 (Teal)
* Token 16/1024 (Green)
* Token 64/1024 (Olive Green)
* Token 256/1024 (Yellow)
* Token 1024/1024 (Gold)
* Token 1/8 (Dark Purple)
* Token 2/8 (Navy)
* Token 4/8 (Dark Teal)
* Token 8/8 (Sky Blue)
### Detailed Analysis
Here's a breakdown of each line's trend and approximate data points. Note that due to the chart's resolution, values are estimates.
* **Token 1/1024 (Purple):** The line is relatively flat, hovering around a test loss of approximately 7.3-7.5 across the entire parameter range.
* **Token 2/1024 (Dark Blue):** Starts at approximately 6.1 at 10<sup>4</sup> parameters, gradually decreasing to around 5.5 at 10<sup>9</sup> parameters.
* **Token 4/1024 (Light Blue):** Begins at approximately 6.0 at 10<sup>4</sup> parameters, decreasing to around 4.8 at 10<sup>9</sup> parameters.
* **Token 8/1024 (Teal):** Starts at approximately 6.0 at 10<sup>4</sup> parameters, decreasing to around 4.5 at 10<sup>9</sup> parameters.
* **Token 16/1024 (Green):** Begins at approximately 6.0 at 10<sup>4</sup> parameters, decreasing to around 4.0 at 10<sup>9</sup> parameters.
* **Token 64/1024 (Olive Green):** Starts at approximately 5.5 at 10<sup>4</sup> parameters, decreasing to around 3.5 at 10<sup>9</sup> parameters.
* **Token 256/1024 (Yellow):** Begins at approximately 5.0 at 10<sup>4</sup> parameters, decreasing to around 3.0 at 10<sup>9</sup> parameters.
* **Token 1024/1024 (Gold):** Starts at approximately 4.8 at 10<sup>4</sup> parameters, decreasing sharply to around 2.5 at 10<sup>9</sup> parameters. This line exhibits the steepest decline.
* **Token 1/8 (Dark Purple):** Similar to Token 1/1024, it remains relatively flat, around 7.3-7.5.
* **Token 2/8 (Navy):** Starts at approximately 6.0 at 10<sup>4</sup> parameters, decreasing to around 5.5 at 10<sup>9</sup> parameters.
* **Token 4/8 (Dark Teal):** Begins at approximately 5.8 at 10<sup>4</sup> parameters, decreasing to around 4.8 at 10<sup>9</sup> parameters.
* **Token 8/8 (Sky Blue):** Starts at approximately 6.0 at 10<sup>4</sup> parameters, decreasing to around 4.5 at 10<sup>9</sup> parameters.
### Key Observations
* The "Token 1024/1024" configuration consistently exhibits the lowest test loss across all parameter values.
* The "Token 1/1024" and "Token 1/8" configurations show minimal improvement in test loss as the number of parameters increases.
* Generally, increasing the number of parameters leads to a decrease in test loss, but the rate of decrease varies significantly depending on the token configuration.
* The lines representing larger token sizes (e.g., 256/1024, 1024/1024) show a more pronounced downward trend.
### Interpretation
The chart demonstrates the impact of token size on model performance (as measured by test loss) as model capacity (number of parameters) increases. The data suggests that larger token sizes, particularly 1024/1024, are more effective at leveraging increased model capacity to reduce test loss. This implies that the model benefits from having a richer representation of the input data when the number of parameters is sufficiently large.
The relatively flat lines for smaller token sizes (1/1024, 1/8) indicate that these configurations may be limited by their representational capacity, regardless of the number of parameters. The model is unable to effectively utilize the additional parameters to improve performance.
The logarithmic scale on the x-axis highlights the diminishing returns of adding parameters. While increasing parameters initially leads to significant reductions in test loss, the rate of improvement slows down as the number of parameters grows very large. This suggests that there is a point of diminishing returns where adding more parameters provides only marginal improvements in performance.
The differences between the 1024 and 8 token sizes are more pronounced than the differences between the 1, 2, and 4 token sizes. This suggests that the relationship between token size and performance is not linear.