## Grouped Bar Chart: Absolute Performance by Domain
### Overview
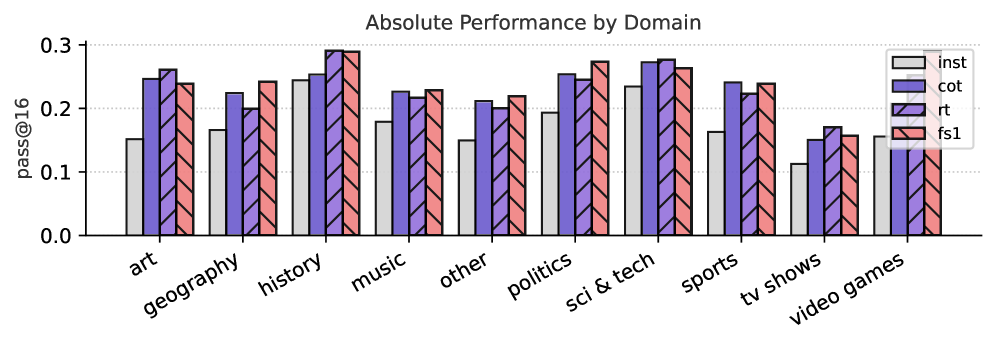
The image displays a grouped bar chart titled "Absolute Performance by Domain." It compares the performance of four different methods or models (labeled `inst`, `cot`, `rt`, and `fs1`) across ten distinct knowledge domains. Performance is measured by the metric "pass@16" on the y-axis.
### Components/Axes
* **Chart Title:** "Absolute Performance by Domain" (centered at the top).
* **Y-Axis:**
* **Label:** "pass@16" (rotated vertically on the left).
* **Scale:** Linear scale from 0.0 to 0.3, with major tick marks at 0.0, 0.1, 0.2, and 0.3.
* **X-Axis:**
* **Categories (Domains):** Ten categories listed from left to right: `art`, `geography`, `history`, `music`, `other`, `politics`, `sci & tech`, `sports`, `tv shows`, `video games`.
* **Legend:** Located in the top-right corner of the chart area. It defines the four data series:
* `inst`: Light gray solid fill.
* `cot`: Purple solid fill.
* `rt`: Purple fill with diagonal black stripes (hatching).
* `fs1`: Pink/salmon fill with diagonal black stripes (hatching).
### Detailed Analysis
The following table reconstructs the approximate "pass@16" values for each method within each domain. Values are estimated from the bar heights relative to the y-axis grid lines.
| Domain | `inst` (Gray) | `cot` (Purple) | `rt` (Striped Purple) | `fs1` (Striped Pink) |
| :--- | :--- | :--- | :--- | :--- |
| **art** | ~0.15 | ~0.25 | ~0.26 | ~0.24 |
| **geography** | ~0.16 | ~0.22 | ~0.20 | ~0.24 |
| **history** | ~0.24 | ~0.25 | ~0.29 | ~0.29 |
| **music** | ~0.18 | ~0.22 | ~0.21 | ~0.23 |
| **other** | ~0.15 | ~0.21 | ~0.19 | ~0.22 |
| **politics** | ~0.19 | ~0.25 | ~0.24 | ~0.27 |
| **sci & tech** | ~0.23 | ~0.27 | ~0.28 | ~0.26 |
| **sports** | ~0.16 | ~0.24 | ~0.22 | ~0.24 |
| **tv shows** | ~0.11 | ~0.15 | ~0.17 | ~0.16 |
| **video games** | ~0.15 | ~0.14 | ~0.16 | ~0.15 |
**Trend Verification per Data Series:**
* **`inst` (Gray):** Generally the lowest-performing method across most domains. Shows a notable peak in `history` (~0.24) and `sci & tech` (~0.23), and a significant dip in `tv shows` (~0.11).
* **`cot` (Purple):** Consistently performs in the mid-to-high range. Its trend is relatively stable, with values mostly between 0.20 and 0.27, except for lower performance in `tv shows` and `video games`.
* **`rt` (Striped Purple):** Often performs similarly to or slightly better than `cot`. It achieves the highest single value on the chart in `history` (~0.29). Its performance dips in `tv shows` and `video games`.
* **`fs1` (Striped Pink):** Frequently the top or tied-for-top performer, especially in `history`, `politics`, and `geography`. It shows a similar pattern of lower scores in `tv shows` and `video games`.
### Key Observations
1. **Domain Performance Hierarchy:** The domains `history` and `sci & tech` show the highest overall performance across all methods, with multiple bars reaching or exceeding 0.25. Conversely, `tv shows` and `video games` are the lowest-performing domains, with all methods scoring below 0.20.
2. **Method Comparison:** The `inst` method is consistently outperformed by the other three methods (`cot`, `rt`, `fs1`) in every domain except `video games`, where all methods perform similarly poorly.
3. **Top Performers:** The `fs1` and `rt` methods (both with striped patterns) frequently achieve the highest scores within a domain, particularly in `history` (tied at ~0.29) and `politics` (`fs1` leads).
4. **Notable Outlier:** The `history` domain is an outlier for the `rt` method, which shows a dramatic spike to ~0.29, its highest value by a significant margin.
### Interpretation
This chart likely evaluates the efficacy of different prompting or reasoning techniques (e.g., `inst`=Instruction, `cot`=Chain-of-Thought, `rt`=Reasoning Tree, `fs1`=Few-Shot 1) on a question-answering or knowledge-retrieval task, measured by the "pass@16" metric (possibly the probability of a correct answer within 16 attempts).
The data suggests that **domain knowledge significantly impacts model performance**. Abstract or culturally nuanced domains like `history` and `sci & tech` yield higher scores, possibly because they contain more structured or factual information within the model's training data. In contrast, domains like `tv shows` and `video games`, which may rely on pop culture, temporal trends, or highly specific details, prove more challenging for all methods.
Furthermore, the **technique matters**. The consistent underperformance of `inst` indicates that simple instructions are less effective than more structured reasoning approaches (`cot`, `rt`) or examples (`fs1`). The strong performance of `fs1` and `rt` implies that providing a reasoning framework or a single example can substantially boost accuracy across diverse topics. The chart effectively demonstrates that both the *subject matter* and the *problem-solving strategy* are critical determinants of success.