## Bar Chart: Cognitive Bias Detection Frequency by Type
### Overview
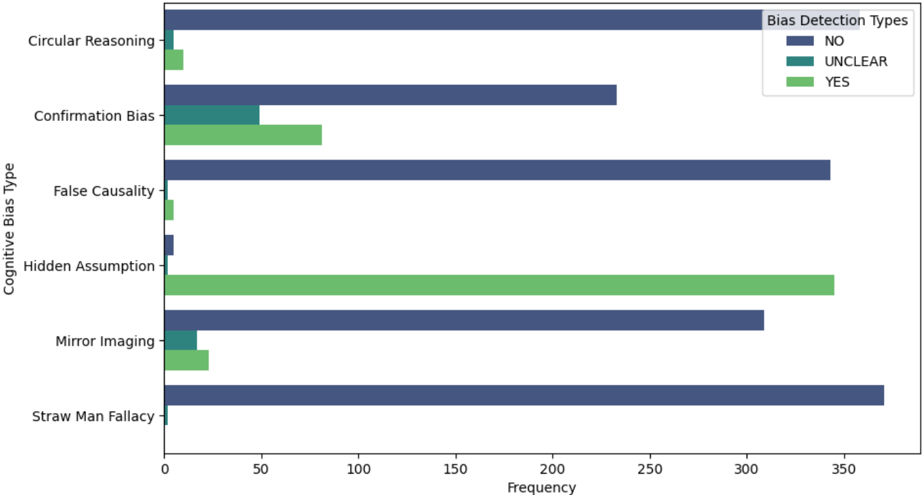
The chart visualizes the frequency of cognitive bias detection across six bias types (Circular Reasoning, Confirmation Bias, False Causality, Hidden Assumption, Mirror Imaging, Straw Man Fallacy) using three detection categories: NO (dark blue), UNCLEAR (teal), and YES (green). The x-axis represents frequency (0–350), and the y-axis lists bias types.
### Components/Axes
- **X-axis**: Frequency (0–350, increments of 50)
- **Y-axis**: Cognitive Bias Type (Circular Reasoning to Straw Man Fallacy)
- **Legend**:
- NO (dark blue)
- UNCLEAR (teal)
- YES (green)
- **Legend Position**: Top-right corner
### Detailed Analysis
1. **Circular Reasoning**
- NO (dark blue): ~360
- UNCLEAR (teal): ~5
- YES (green): ~10
2. **Confirmation Bias**
- NO (dark blue): ~230
- UNCLEAR (teal): ~50
- YES (green): ~80
3. **False Causality**
- NO (dark blue): ~340
- UNCLEAR (teal): ~2
- YES (green): ~5
4. **Hidden Assumption**
- NO (dark blue): ~5
- UNCLEAR (teal): ~2
- YES (green): ~340
5. **Mirror Imaging**
- NO (dark blue): ~310
- UNCLEAR (teal): ~20
- YES (green): ~25
6. **Straw Man Fallacy**
- NO (dark blue): ~370
- UNCLEAR (teal): ~2
- YES (green): ~3
### Key Observations
- **Dominance of NO**: Most biases (Circular Reasoning, False Causality, Mirror Imaging, Straw Man Fallacy) show the highest frequency in the NO category, suggesting they are often undetected.
- **Hidden Assumption Outlier**: The YES category dominates for Hidden Assumption (~340), indicating it is frequently identified correctly.
- **Confirmation Bias Ambiguity**: Confirmation Bias has a notable UNCLEAR frequency (~50), higher than YES (~80) and NO (~230), suggesting detection uncertainty.
- **Straw Man Fallacy Extremes**: Straw Man Fallacy has the highest NO (~370) and lowest YES (~3), implying it is rarely detected accurately.
### Interpretation
The data suggests cognitive biases are generally under-detected (NO), with Hidden Assumption being a notable exception where detection is robust (YES). Confirmation Bias stands out for its UNCLEAR frequency, highlighting ambiguity in its identification. Straw Man Fallacy’s extreme NO frequency (~370) may indicate systemic challenges in recognizing this bias, while its minimal YES (~3) suggests rare accurate detections. The UNCLEAR category’s sparsity (except for Confirmation Bias) implies most biases are either clearly present or absent, with limited intermediate uncertainty. This could reflect detection thresholds or training data biases favoring binary classifications.