## [Combination Bar and Line Chart]: Model Performance Across Datasets
### Overview
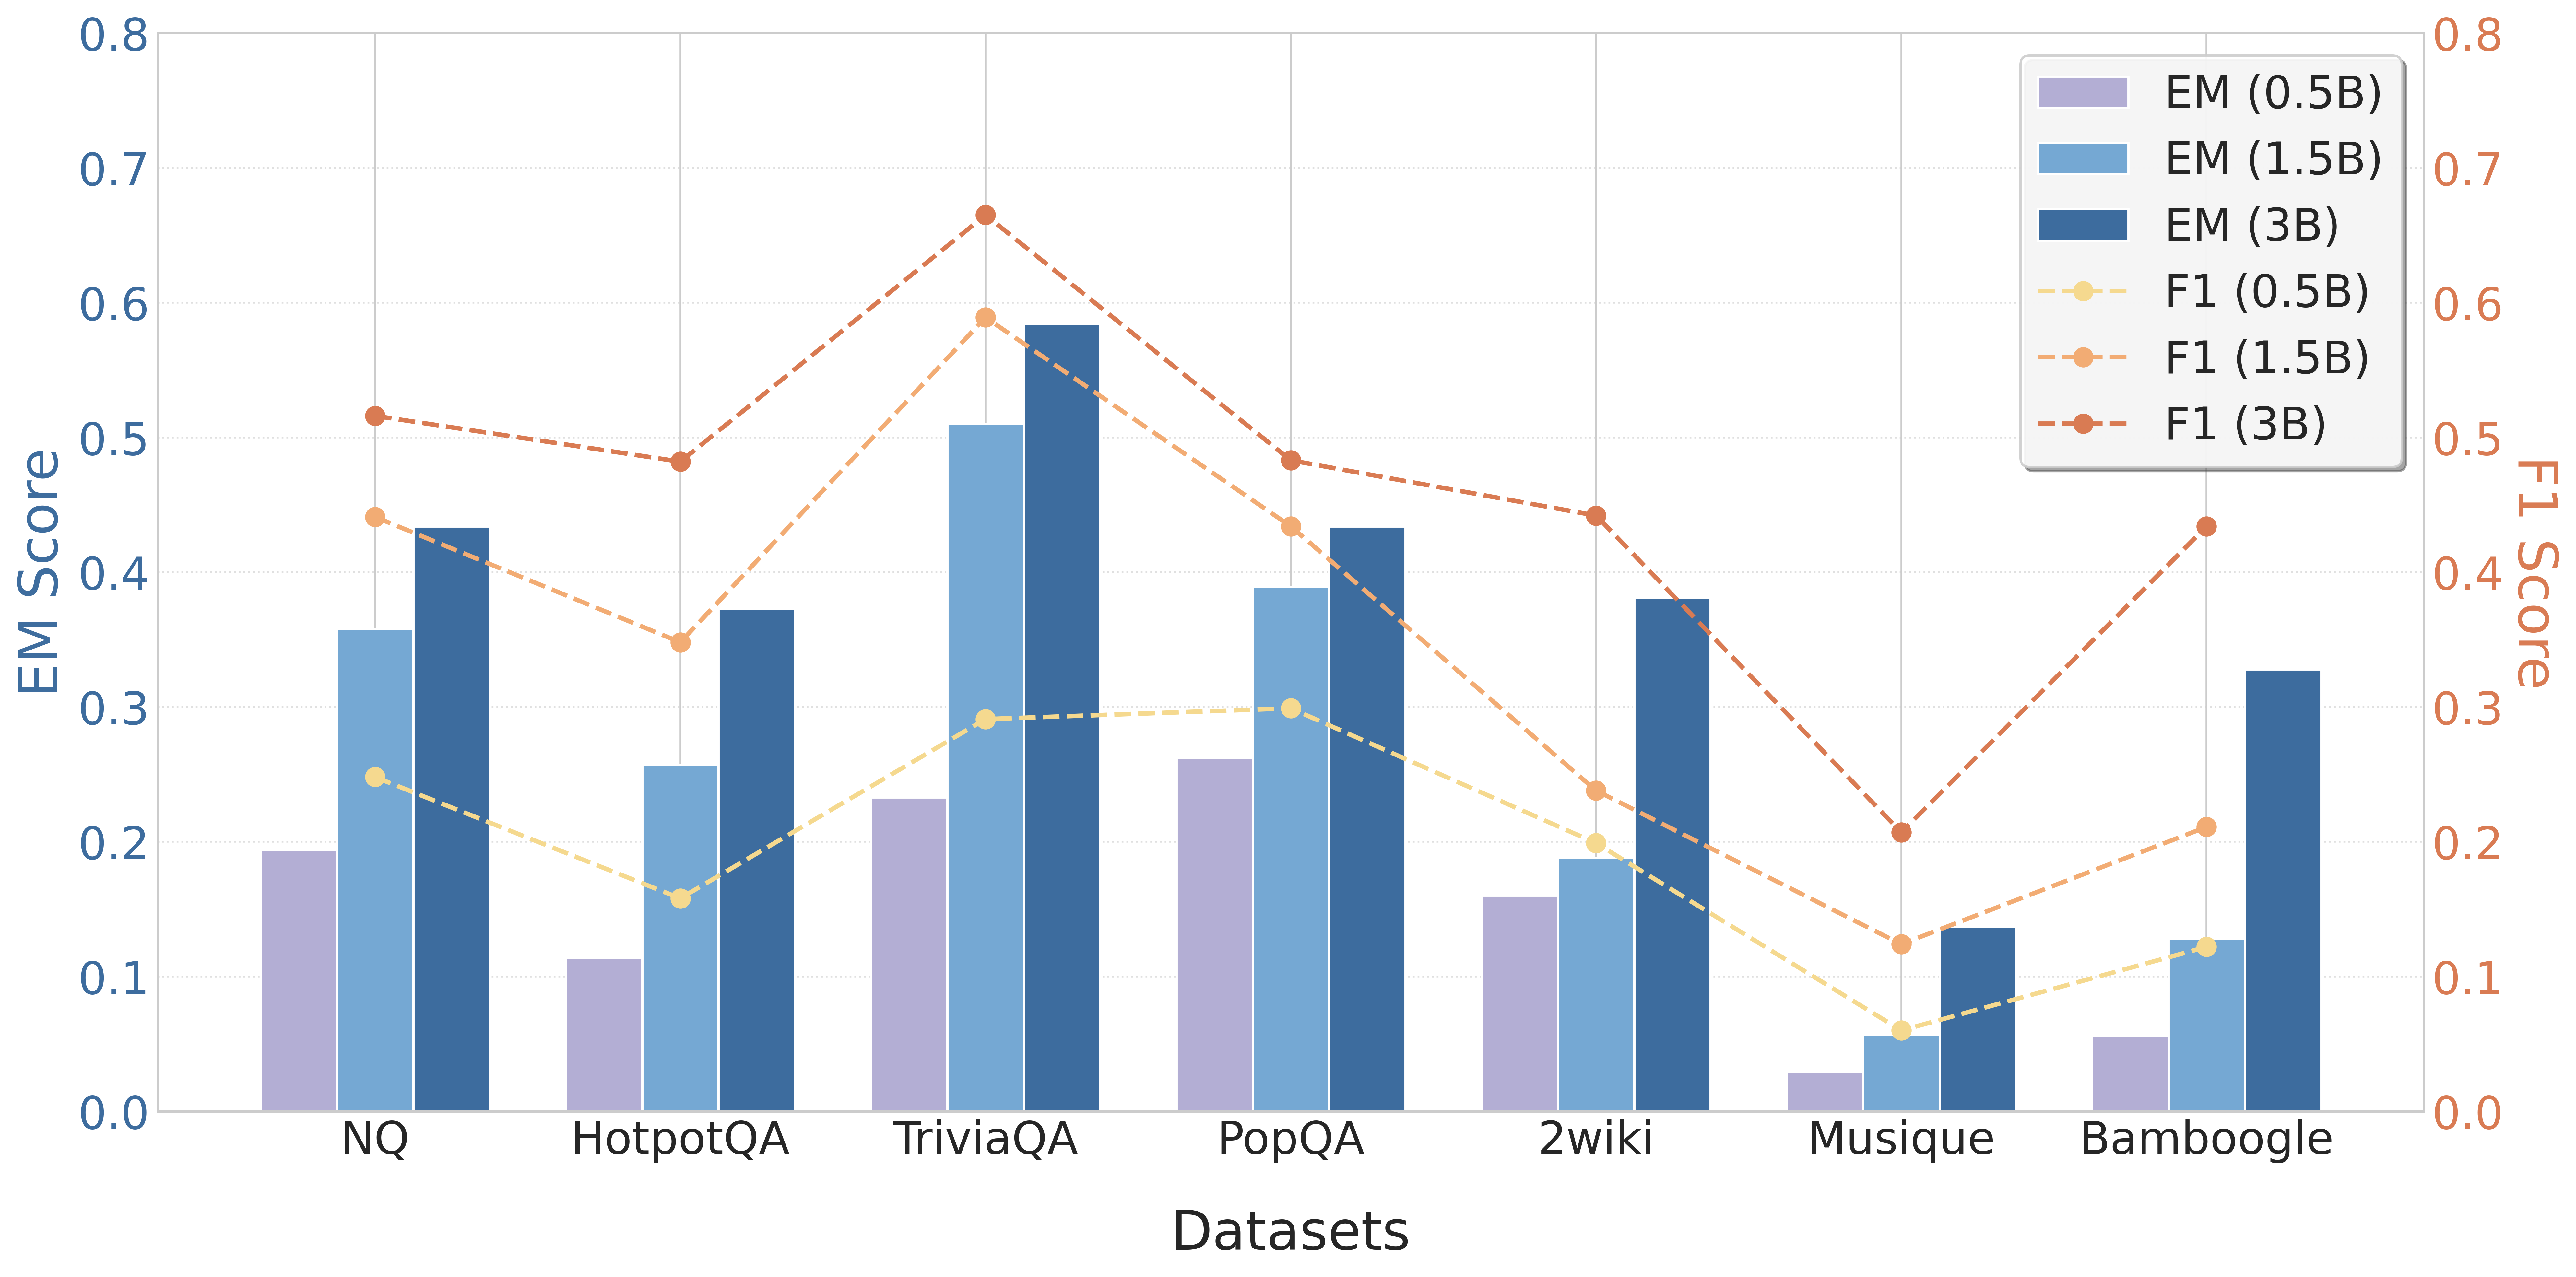
This image displays a combination chart comparing the performance of three different model sizes (0.5B, 1.5B, and 3B parameters) across seven question-answering datasets. Performance is measured using two metrics: Exact Match (EM) Score, represented by bars, and F1 Score, represented by dashed lines with markers. The chart uses a dual y-axis layout.
### Components/Axes
* **Chart Type:** Grouped bar chart with overlaid line chart.
* **X-Axis (Bottom):** Labeled "Datasets". It lists seven categorical datasets from left to right: `NQ`, `HotpotQA`, `TriviaQA`, `PopQA`, `2wiki`, `Musique`, `Bamboogle`.
* **Primary Y-Axis (Left):** Labeled "EM Score". Scale ranges from 0.0 to 0.8 in increments of 0.1. This axis corresponds to the bar heights.
* **Secondary Y-Axis (Right):** Labeled "F1 Score". Scale ranges from 0.0 to 0.8 in increments of 0.1. This axis corresponds to the line chart data points.
* **Legend (Top-Right Corner):** Contains six entries, differentiating the data series by color and style:
* **Bars (EM Score):**
* `EM (0.5B)`: Light purple/lavender bar.
* `EM (1.5B)`: Medium blue bar.
* `EM (3B)`: Dark blue bar.
* **Lines (F1 Score):**
* `F1 (0.5B)`: Light yellow dashed line with circular markers.
* `F1 (1.5B)`: Light orange dashed line with circular markers.
* `F1 (3B)`: Dark orange/rust dashed line with circular markers.
### Detailed Analysis
**Data Extraction by Dataset (Approximate Values):**
1. **NQ**
* **EM (Bars):** 0.5B ≈ 0.19, 1.5B ≈ 0.36, 3B ≈ 0.43.
* **F1 (Lines):** 0.5B ≈ 0.25, 1.5B ≈ 0.44, 3B ≈ 0.52.
* *Trend:* Clear stepwise increase in both EM and F1 with model size.
2. **HotpotQA**
* **EM (Bars):** 0.5B ≈ 0.11, 1.5B ≈ 0.26, 3B ≈ 0.37.
* **F1 (Lines):** 0.5B ≈ 0.16, 1.5B ≈ 0.35, 3B ≈ 0.48.
* *Trend:* Similar stepwise increase. The gap between 1.5B and 3B F1 scores is notably large.
3. **TriviaQA**
* **EM (Bars):** 0.5B ≈ 0.23, 1.5B ≈ 0.51, 3B ≈ 0.58.
* **F1 (Lines):** 0.5B ≈ 0.29, 1.5B ≈ 0.59, 3B ≈ 0.67.
* *Trend:* Highest overall performance for all model sizes. The 1.5B model shows a very large jump from the 0.5B model.
4. **PopQA**
* **EM (Bars):** 0.5B ≈ 0.26, 1.5B ≈ 0.39, 3B ≈ 0.43.
* **F1 (Lines):** 0.5B ≈ 0.30, 1.5B ≈ 0.43, 3B ≈ 0.49.
* *Trend:* Consistent increase with model size, though the incremental gain from 1.5B to 3B is smaller than on some other datasets.
5. **2wiki**
* **EM (Bars):** 0.5B ≈ 0.16, 1.5B ≈ 0.19, 3B ≈ 0.38.
* **F1 (Lines):** 0.5B ≈ 0.20, 1.5B ≈ 0.24, 3B ≈ 0.44.
* *Trend:* The 0.5B and 1.5B models perform similarly, with a significant leap in performance for the 3B model.
6. **Musique**
* **EM (Bars):** 0.5B ≈ 0.03, 1.5B ≈ 0.06, 3B ≈ 0.14.
* **F1 (Lines):** 0.5B ≈ 0.06, 1.5B ≈ 0.13, 3B ≈ 0.21.
* *Trend:* The lowest-performing dataset for all models. Shows the smallest absolute scores but maintains the relative trend of improvement with scale.
7. **Bamboogle**
* **EM (Bars):** 0.5B ≈ 0.06, 1.5B ≈ 0.13, 3B ≈ 0.33.
* **F1 (Lines):** 0.5B ≈ 0.13, 1.5B ≈ 0.21, 3B ≈ 0.44.
* *Trend:* Similar pattern to 2wiki, with a very large performance jump from the 1.5B to the 3B model.
### Key Observations
1. **Consistent Scaling Law:** Across all seven datasets, both EM and F1 scores increase with model parameter count (0.5B → 1.5B → 3B). There is no instance where a smaller model outperforms a larger one on a given dataset for a given metric.
2. **Dataset Difficulty Spectrum:** There is a wide variance in absolute performance across datasets. `TriviaQA` appears to be the "easiest" (highest scores), while `Musique` is the "hardest" (lowest scores).
3. **Metric Correlation:** The EM (bar) and F1 (line) scores for a given model size on a given dataset are closely correlated. When one is high, the other is high, and vice-versa.
4. **Non-Linear Gains:** The performance improvement from 0.5B to 1.5B is often larger than the improvement from 1.5B to 3B (e.g., TriviaQA, PopQA). However, for some datasets like `2wiki` and `Bamboogle`, the jump from 1.5B to 3B is particularly pronounced.
5. **F1 Scores are Higher:** For every data point, the F1 score (line) is higher than the corresponding EM score (bar) for the same model and dataset. This is expected, as F1 is a more lenient metric that allows for partial credit.
### Interpretation
This chart provides a clear empirical demonstration of scaling laws in language models for question-answering tasks. The data suggests that increasing model capacity (from 0.5B to 3B parameters) leads to robust and predictable improvements in both exact match and fuzzy match (F1) performance.
The significant variation in scores across datasets highlights that task difficulty is not uniform. Datasets like `TriviaQA` may contain more factual, straightforward questions, while `Musique` and `Bamboogle` likely involve more complex reasoning, multi-hop inference, or adversarial examples, making them harder for all model sizes.
The consistent gap between F1 and EM scores indicates that even when models fail to produce the exact answer string, they often generate responses that contain relevant keywords or partial information. The most interesting finding is the dataset-specific scaling behavior: while all models improve with size, the *rate* of improvement is not constant. Some datasets (`2wiki`, `Bamboogle`) appear to "unlock" significantly only at the 3B scale, suggesting they may require a certain threshold of model capacity or world knowledge to solve effectively. This has implications for model selection and evaluation, indicating that performance on a single benchmark may not predict scaling behavior on another.