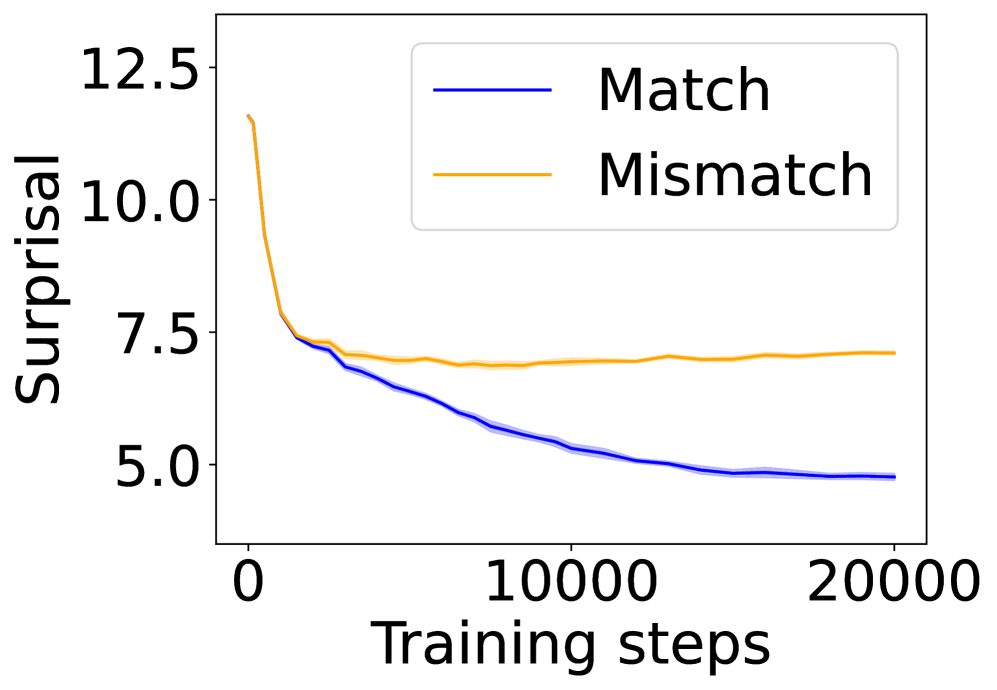
## Line Chart: Surprisal vs. Training Steps
### Overview
The image is a line chart that plots "Surprisal" against "Training steps". Two data series are represented: "Match" (blue line) and "Mismatch" (orange line). Both lines show a decrease in surprisal as training steps increase, but the "Match" line decreases more significantly and stabilizes at a lower surprisal value than the "Mismatch" line. Shaded regions around each line indicate uncertainty or variance.
### Components/Axes
* **X-axis:** "Training steps", ranging from 0 to 20000.
* **Y-axis:** "Surprisal", ranging from 5.0 to 12.5, with increments of 2.5.
* **Legend:** Located in the top-right corner.
* "Match": Represented by a blue line.
* "Mismatch": Represented by an orange line.
### Detailed Analysis
* **Match (Blue Line):**
* Trend: Decreases from approximately 7.5 at 0 training steps to approximately 5.0 at 20000 training steps.
* Initial Value: ~7.5
* Final Value: ~5.0
* The line decreases rapidly initially, then the rate of decrease slows down as the number of training steps increases.
* **Mismatch (Orange Line):**
* Trend: Decreases from approximately 12.0 at 0 training steps to approximately 7.25 at 20000 training steps.
* Initial Value: ~12.0
* Final Value: ~7.25
* The line decreases rapidly initially, then stabilizes around 7.25 after approximately 5000 training steps.
* **Uncertainty:** Shaded regions around each line indicate the uncertainty or variance in the data. The uncertainty appears to decrease as the number of training steps increases, especially for the "Match" line.
### Key Observations
* The "Mismatch" line starts at a much higher surprisal value than the "Match" line.
* Both lines show a decrease in surprisal with increasing training steps, indicating that the model learns over time.
* The "Match" line stabilizes at a lower surprisal value than the "Mismatch" line, suggesting that the model performs better when there is a match.
* The uncertainty decreases as the number of training steps increases, indicating that the model becomes more confident in its predictions.
### Interpretation
The chart demonstrates the learning process of a model, showing how surprisal decreases with training. The difference between the "Match" and "Mismatch" lines suggests that the model is better at predicting or processing matching data compared to mismatched data. The decreasing uncertainty indicates that the model's predictions become more reliable as it trains. The initial rapid decrease in surprisal for both lines suggests that the model learns quickly at the beginning, with diminishing returns as training progresses.