## Line Chart: Head Influence Curves (Llama3.1-8B-Instruct; QUALITY)
### Overview
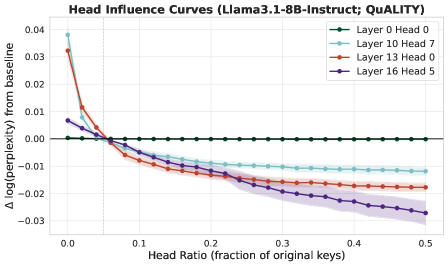
The chart visualizes the impact of removing attention heads in different layers of the Llama3.1-8B-Instruct model on quality metrics (measured via perplexity). It shows how reducing the number of active heads (head ratio) affects model performance relative to a baseline.
### Components/Axes
- **X-axis**: Head Ratio (fraction of original keys)
- Scale: 0.0 to 0.5 in increments of 0.1
- Label: "Head Ratio (fraction of original keys)"
- **Y-axis**: Δ log(perplexity) from baseline
- Scale: -0.03 to 0.04 in increments of 0.01
- Label: "Δ log(perplexity) from baseline"
- **Legend**:
- **Layer 0 Head 0** (green line)
- **Layer 10 Head 7** (light blue line)
- **Layer 13 Head 0** (red line)
- **Layer 16 Head 5** (purple line)
- Legend positioned in the top-right corner.
### Detailed Analysis
1. **Layer 0 Head 0 (Green Line)**:
- Remains flat at **0.00** across all head ratios.
- Confidence interval (shaded area) is minimal, indicating low variability.
2. **Layer 10 Head 7 (Light Blue Line)**:
- Starts at **0.04** (head ratio = 0.0) and decreases linearly to **-0.01** at head ratio = 0.5.
- Confidence interval widens slightly but remains narrow.
3. **Layer 13 Head 0 (Red Line)**:
- Sharp initial drop from **0.03** (head ratio = 0.0) to **-0.01** (head ratio = 0.1), then stabilizes.
- Confidence interval is broader than Layer 0 but narrower than Layer 16.
4. **Layer 16 Head 5 (Purple Line)**:
- Gradual decline from **0.01** (head ratio = 0.0) to **-0.03** (head ratio = 0.5).
- Confidence interval widens significantly, showing higher uncertainty.
### Key Observations
- **Layer 0 Head 0** is the only head with no measurable impact on perplexity, suggesting it may be redundant or optimized during training.
- **Layer 13 Head 0** exhibits the most dramatic initial performance drop, indicating critical importance in early stages of head removal.
- **Layer 16 Head 5** shows the most consistent negative trend, implying a strong dependency on this head for maintaining quality.
- Confidence intervals suggest **Layer 0** has the most reliable measurements, while **Layer 16** has the highest variability.
### Interpretation
The data demonstrates that removing attention heads generally degrades model quality (higher perplexity), with effects varying by layer and head. Layer 0 Head 0’s stability suggests it may not contribute meaningfully to performance, while Layer 13 Head 0’s sharp decline highlights its critical role. The widening confidence intervals for Layer 16 Head 5 imply greater uncertainty in its influence, possibly due to architectural complexity or training dynamics. These results underscore the importance of head-specific analysis in model optimization and pruning strategies.