\n
## Scatter Plot: Confidence vs. Target Length (Anatomy)
### Overview
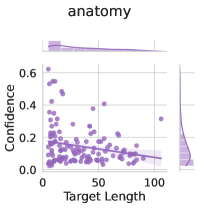
The image presents a scatter plot visualizing the relationship between "Target Length" and "Confidence". A regression line with a shaded confidence interval is overlaid on the scatter points. The plot is titled "anatomy".
### Components/Axes
* **Title:** anatomy (top-center)
* **X-axis:** "Target Length" (bottom-center), ranging from approximately 0 to 110.
* **Y-axis:** "Confidence" (left-center), ranging from approximately 0 to 0.6.
* **Data Points:** Numerous purple circles representing individual data points.
* **Regression Line:** A purple line representing the trend of the data. The line slopes downward.
* **Confidence Interval:** A shaded purple area around the regression line, indicating the uncertainty in the estimated trend.
* **Histograms:** Two histograms are present at the top and right sides of the plot, showing the distributions of "Target Length" and "Confidence" respectively.
### Detailed Analysis
The scatter plot shows a negative correlation between "Target Length" and "Confidence". As "Target Length" increases, "Confidence" tends to decrease.
* **Trend:** The regression line has a negative slope, confirming the negative correlation.
* **Data Point Distribution:** The data points are densely clustered near the origin (low "Target Length", low "Confidence"). As "Target Length" increases, the points become more dispersed, but generally remain at lower "Confidence" levels.
* **Approximate Data Points (sampled):**
* Target Length = 0, Confidence ≈ 0.35
* Target Length = 10, Confidence ≈ 0.40
* Target Length = 20, Confidence ≈ 0.25
* Target Length = 30, Confidence ≈ 0.18
* Target Length = 40, Confidence ≈ 0.15
* Target Length = 50, Confidence ≈ 0.12
* Target Length = 60, Confidence ≈ 0.10
* Target Length = 70, Confidence ≈ 0.08
* Target Length = 80, Confidence ≈ 0.06
* Target Length = 90, Confidence ≈ 0.04
* Target Length = 100, Confidence ≈ 0.03
* **Histogram (Target Length):** The histogram at the top shows a distribution skewed to the right, with a peak at approximately 0-10.
* **Histogram (Confidence):** The histogram on the right shows a distribution skewed to the right, with a peak at approximately 0-0.1.
### Key Observations
* The negative correlation between "Target Length" and "Confidence" is visually apparent.
* The confidence interval around the regression line is relatively narrow, suggesting a reasonably strong and consistent relationship.
* The distributions of both "Target Length" and "Confidence" are skewed, indicating that lower values are more common.
### Interpretation
The data suggests that as the "Target Length" increases, the "Confidence" in something (likely a prediction or identification related to "anatomy") decreases. This could indicate that longer targets are more difficult to analyze or identify with high confidence. The skewed distributions suggest that the majority of targets are relatively short and/or the confidence levels are generally low. The regression line provides a quantitative estimate of the relationship, while the confidence interval quantifies the uncertainty in that estimate. The title "anatomy" suggests this data relates to the analysis of anatomical structures or features. The histograms provide additional context about the overall distributions of the variables.