## Chart: Model Performance Comparison (ECE & AUROC)
### Overview
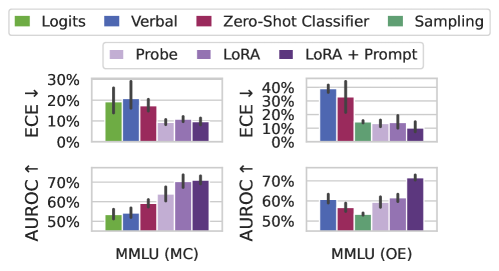
The image presents a 2x2 grid of bar charts comparing the performance of different model configurations on two datasets: MMLU (MC) and MMLU (OE). The charts display two metrics: Expected Calibration Error (ECE) and Area Under the Receiver Operating Characteristic curve (AUROC). The model configurations are differentiated by training method (Logits, Verbal, Zero-Shot Classifier, Sampling) and fine-tuning technique (Probe, LoRA, LoRA + Prompt). Error bars are present on each bar, indicating variance.
### Components/Axes
* **X-axis:** MMLU (MC) and MMLU (OE) – representing the two datasets used for evaluation.
* **Y-axis (Top Row):** ECE ↓ – Expected Calibration Error, with lower values indicating better calibration. Scale ranges from 0% to 30%.
* **Y-axis (Bottom Row):** AUROC ↑ – Area Under the Receiver Operating Characteristic curve, with higher values indicating better performance. Scale ranges from 50% to 70%.
* **Legend (Top):**
* Green: Logits
* Blue: Verbal
* Magenta: Zero-Shot Classifier
* Dark Green: Sampling
* **Legend (Bottom):**
* Light Purple: Probe
* Purple: LoRA
* Dark Purple: LoRA + Prompt
### Detailed Analysis or Content Details
**Top-Left Chart: ECE - MMLU (MC)**
* **Logits (Green):** Approximately 22% ± 3% (estimated from error bar).
* **Verbal (Blue):** Approximately 16% ± 2%.
* **Zero-Shot Classifier (Magenta):** Approximately 13% ± 2%.
* **Sampling (Dark Green):** Approximately 11% ± 2%.
* **Probe (Light Purple):** Approximately 11% ± 2%.
* **LoRA (Purple):** Approximately 9% ± 2%.
* **LoRA + Prompt (Dark Purple):** Approximately 8% ± 2%.
**Top-Right Chart: ECE - MMLU (OE)**
* **Logits (Green):** Approximately 12% ± 2%.
* **Verbal (Blue):** Approximately 25% ± 3%.
* **Zero-Shot Classifier (Magenta):** Approximately 15% ± 2%.
* **Sampling (Dark Green):** Approximately 10% ± 2%.
* **Probe (Light Purple):** Approximately 13% ± 2%.
* **LoRA (Purple):** Approximately 10% ± 2%.
* **LoRA + Prompt (Dark Purple):** Approximately 9% ± 2%.
**Bottom-Left Chart: AUROC - MMLU (MC)**
* **Logits (Green):** Approximately 54% ± 2%.
* **Verbal (Blue):** Approximately 57% ± 2%.
* **Zero-Shot Classifier (Magenta):** Approximately 64% ± 2%.
* **Sampling (Dark Green):** Approximately 66% ± 2%.
* **Probe (Light Purple):** Approximately 68% ± 2%.
* **LoRA (Purple):** Approximately 69% ± 2%.
* **LoRA + Prompt (Dark Purple):** Approximately 70% ± 2%.
**Bottom-Right Chart: AUROC - MMLU (OE)**
* **Logits (Green):** Approximately 55% ± 2%.
* **Verbal (Blue):** Approximately 60% ± 2%.
* **Zero-Shot Classifier (Magenta):** Approximately 63% ± 2%.
* **Sampling (Dark Green):** Approximately 65% ± 2%.
* **Probe (Light Purple):** Approximately 66% ± 2%.
* **LoRA (Purple):** Approximately 68% ± 2%.
* **LoRA + Prompt (Dark Purple):** Approximately 70% ± 2%.
### Key Observations
* For ECE, the "Sampling" and "LoRA + Prompt" methods consistently achieve the lowest error rates across both datasets.
* For AUROC, "LoRA + Prompt" consistently achieves the highest scores across both datasets.
* The "Verbal" method generally performs worse than other methods in terms of ECE, particularly on the MMLU (OE) dataset.
* The error bars suggest that the differences between some methods are statistically significant, while others may not be.
### Interpretation
The data suggests that fine-tuning with LoRA, especially when combined with prompt engineering ("LoRA + Prompt"), significantly improves both calibration (lower ECE) and discriminative ability (higher AUROC) of the models on the MMLU datasets. The "Sampling" method also demonstrates good calibration. The "Verbal" method appears to be less effective, particularly in terms of calibration on the MMLU (OE) dataset.
The two datasets, MMLU (MC) and MMLU (OE), likely represent different evaluation settings or data splits. The consistent trends across both datasets suggest that the observed performance differences are not specific to a particular dataset.
The error bars indicate the variability in performance. The relatively small error bars for "LoRA + Prompt" suggest that this method is more robust and consistently performs well. The larger error bars for some other methods indicate that their performance is more sensitive to the specific data or training conditions.
The combination of ECE and AUROC provides a comprehensive assessment of model performance. A model with low ECE is well-calibrated, meaning its predicted probabilities accurately reflect its confidence. A model with high AUROC is able to effectively discriminate between different classes. "LoRA + Prompt" appears to excel in both aspects.