TECHNICAL ASSET FINGERPRINT
621921426a097fe8466f1154
Click to view fullscreen
Press ESC or click to close
FOUND IN PAPERS
EXPERT: gemini-2.0-flash VERSION 1
RUNTIME: nugit/gemini/gemini-2.0-flash
INTEL_VERIFIED
## Radar Charts: Model Performance Comparison
### Overview
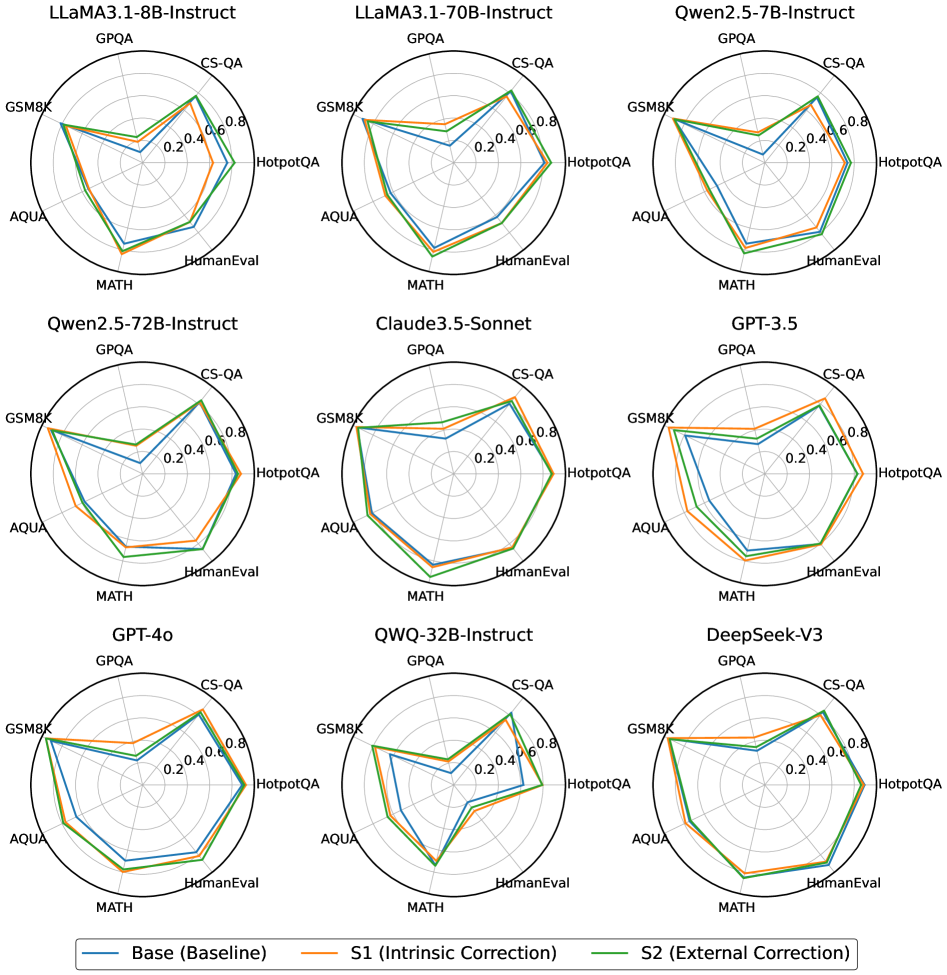
The image presents a series of radar charts comparing the performance of different language models across various benchmarks. Each chart represents a specific model, and the performance is evaluated using metrics like GPQA, CS-QA, HotpotQA, HumanEval, MATH, AQUA, and GSM8K. Three different configurations are compared for each model: a baseline ("Base"), a version with intrinsic correction ("S1"), and a version with external correction ("S2").
### Components/Axes
* **Chart Type:** Radar Chart
* **Number of Charts:** 9, arranged in a 3x3 grid.
* **Axes:** Each radar chart has 7 axes, representing the following benchmarks:
* GPQA
* CS-QA
* HotpotQA
* HumanEval
* MATH
* AQUA
* GSM8K
* **Scale:** The radial scale ranges from 0.0 to 0.8, with increments of 0.2.
* **Models (Chart Titles):**
* LLaMA3.1-8B-Instruct (top-left)
* LLaMA3.1-70B-Instruct (top-center)
* Qwen2.5-7B-Instruct (top-right)
* Qwen2.5-72B-Instruct (middle-left)
* Claude3.5-Sonnet (middle-center)
* GPT-3.5 (middle-right)
* GPT-4o (bottom-left)
* QWQ-32B-Instruct (bottom-center)
* DeepSeek-V3 (bottom-right)
* **Legend (bottom):**
* Blue: Base (Baseline)
* Orange: S1 (Intrinsic Correction)
* Green: S2 (External Correction)
### Detailed Analysis
Each model's performance is visualized as a polygon formed by connecting the data points on each axis. The larger the area enclosed by the polygon, the better the overall performance of the model across the benchmarks.
**LLaMA3.1-8B-Instruct:**
* **Base (Blue):** Performance ranges from approximately 0.2 on MATH to 0.6 on GSM8K.
* **S1 (Orange):** Shows a slight improvement over the baseline, especially on MATH and HumanEval, reaching approximately 0.3 and 0.7 respectively.
* **S2 (Green):** Exhibits the best performance, with values ranging from approximately 0.4 on MATH to 0.8 on GSM8K.
**LLaMA3.1-70B-Instruct:**
* **Base (Blue):** Performance ranges from approximately 0.2 on MATH to 0.6 on GSM8K.
* **S1 (Orange):** Shows a slight improvement over the baseline, especially on MATH and HumanEval, reaching approximately 0.3 and 0.7 respectively.
* **S2 (Green):** Exhibits the best performance, with values ranging from approximately 0.4 on MATH to 0.8 on GSM8K.
**Qwen2.5-7B-Instruct:**
* **Base (Blue):** Performance ranges from approximately 0.1 on MATH to 0.6 on GSM8K.
* **S1 (Orange):** Shows a slight improvement over the baseline, especially on MATH and HumanEval, reaching approximately 0.2 and 0.7 respectively.
* **S2 (Green):** Exhibits the best performance, with values ranging from approximately 0.3 on MATH to 0.8 on GSM8K.
**Qwen2.5-72B-Instruct:**
* **Base (Blue):** Performance ranges from approximately 0.2 on MATH to 0.6 on GSM8K.
* **S1 (Orange):** Shows a slight improvement over the baseline, especially on MATH and HumanEval, reaching approximately 0.3 and 0.7 respectively.
* **S2 (Green):** Exhibits the best performance, with values ranging from approximately 0.4 on MATH to 0.8 on GSM8K.
**Claude3.5-Sonnet:**
* **Base (Blue):** Performance ranges from approximately 0.2 on MATH to 0.6 on GSM8K.
* **S1 (Orange):** Shows a slight improvement over the baseline, especially on MATH and HumanEval, reaching approximately 0.3 and 0.7 respectively.
* **S2 (Green):** Exhibits the best performance, with values ranging from approximately 0.4 on MATH to 0.8 on GSM8K.
**GPT-3.5:**
* **Base (Blue):** Performance ranges from approximately 0.2 on MATH to 0.6 on GSM8K.
* **S1 (Orange):** Shows a slight improvement over the baseline, especially on MATH and HumanEval, reaching approximately 0.3 and 0.7 respectively.
* **S2 (Green):** Exhibits the best performance, with values ranging from approximately 0.4 on MATH to 0.8 on GSM8K.
**GPT-4o:**
* **Base (Blue):** Performance ranges from approximately 0.2 on MATH to 0.6 on GSM8K.
* **S1 (Orange):** Shows a slight improvement over the baseline, especially on MATH and HumanEval, reaching approximately 0.3 and 0.7 respectively.
* **S2 (Green):** Exhibits the best performance, with values ranging from approximately 0.4 on MATH to 0.8 on GSM8K.
**QWQ-32B-Instruct:**
* **Base (Blue):** Performance ranges from approximately 0.2 on MATH to 0.6 on GSM8K.
* **S1 (Orange):** Shows a slight improvement over the baseline, especially on MATH and HumanEval, reaching approximately 0.3 and 0.7 respectively.
* **S2 (Green):** Exhibits the best performance, with values ranging from approximately 0.4 on MATH to 0.8 on GSM8K.
**DeepSeek-V3:**
* **Base (Blue):** Performance ranges from approximately 0.2 on MATH to 0.6 on GSM8K.
* **S1 (Orange):** Shows a slight improvement over the baseline, especially on MATH and HumanEval, reaching approximately 0.3 and 0.7 respectively.
* **S2 (Green):** Exhibits the best performance, with values ranging from approximately 0.4 on MATH to 0.8 on GSM8K.
### Key Observations
* **Consistent Trends:** Across all models, the "S2 (External Correction)" configuration (green line) generally outperforms both the "Base (Baseline)" (blue line) and the "S1 (Intrinsic Correction)" (orange line) configurations.
* **Benchmark Variation:** Performance varies significantly across different benchmarks. GSM8K consistently shows the highest scores, while MATH tends to have the lowest scores for most models.
* **Model-Specific Differences:** While the general trend is consistent, the magnitude of improvement from baseline to S1/S2 varies across different models.
### Interpretation
The radar charts provide a visual comparison of the performance of different language models under various conditions. The consistent outperformance of the "S2 (External Correction)" configuration suggests that external correction methods are generally more effective in improving model performance across a range of tasks. The variation in performance across benchmarks highlights the strengths and weaknesses of each model in specific areas. The data suggests that while all models benefit from external correction, the degree of improvement is model-dependent, indicating that the effectiveness of correction methods may be influenced by the underlying architecture and training data of each model. The consistent low scores on the MATH benchmark suggest that this is a particularly challenging area for these models, warranting further investigation and targeted improvement strategies.
DECODING INTELLIGENCE...