## Dual-Axis Line Chart: Training Metrics Over Steps
### Overview
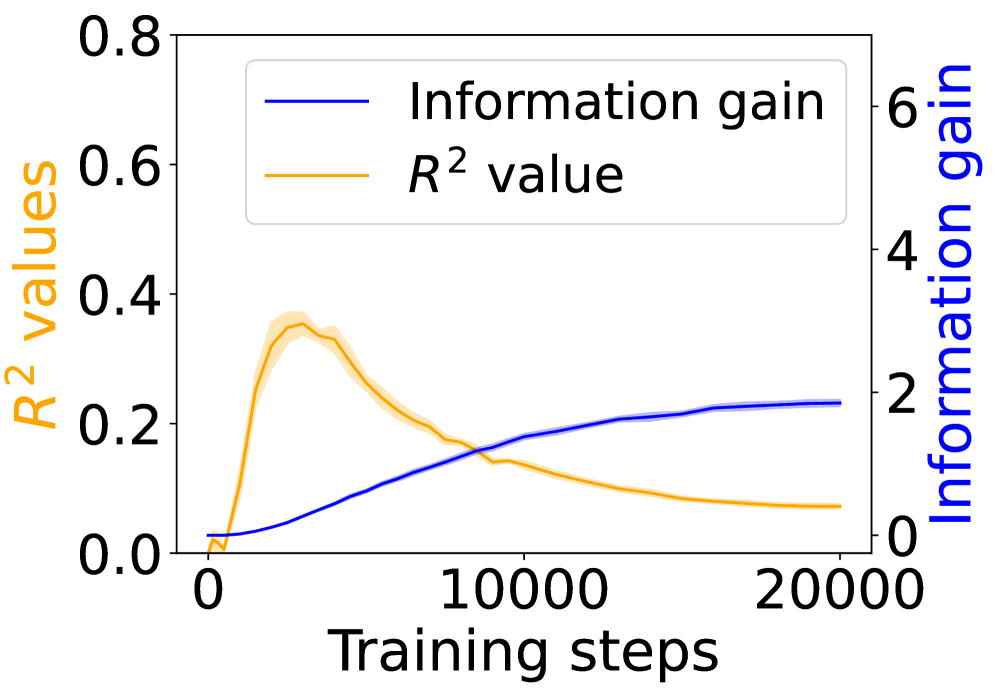
The image displays a dual-axis line chart plotting two different metrics against the number of training steps. The chart compares the progression of "Information gain" and "R² value" over a training period of 20,000 steps. The visual suggests a relationship where one metric improves steadily while the other peaks early and then declines.
### Components/Axes
* **Chart Type:** Dual-axis line chart.
* **X-Axis (Bottom):**
* **Label:** "Training steps"
* **Scale:** Linear, from 0 to 20,000.
* **Major Tick Marks:** 0, 10000, 20000.
* **Primary Y-Axis (Left):**
* **Label:** "R² values" (text color: orange).
* **Scale:** Linear, from 0.0 to 0.8.
* **Major Tick Marks:** 0.0, 0.2, 0.4, 0.6, 0.8.
* **Secondary Y-Axis (Right):**
* **Label:** "Information gain" (text color: blue).
* **Scale:** Linear, from 0 to 6.
* **Major Tick Marks:** 0, 2, 4, 6.
* **Legend:**
* **Position:** Top-left corner, inside the plot area.
* **Entry 1:** A blue line labeled "Information gain".
* **Entry 2:** An orange line labeled "R² value".
* **Data Series:**
1. **Blue Line ("Information gain"):** A solid blue line corresponding to the right y-axis.
2. **Orange Line ("R² value"):** A solid orange line corresponding to the left y-axis. This line is accompanied by a semi-transparent orange shaded region, likely representing a confidence interval or standard deviation across multiple runs.
### Detailed Analysis
* **Trend Verification - Information Gain (Blue Line):**
* **Visual Trend:** The line shows a smooth, monotonic increase. It starts near zero, rises steadily with a slightly decreasing slope, and begins to plateau in the later stages.
* **Data Points (Approximate):**
* Step 0: ~0.1
* Step 5000: ~1.0
* Step 10000: ~1.8
* Step 15000: ~2.1
* Step 20000: ~2.2 (plateauing)
* **Trend Verification - R² Value (Orange Line):**
* **Visual Trend:** The line exhibits a sharp initial increase to a peak, followed by a gradual, sustained decline.
* **Data Points (Approximate):**
* Step 0: 0.0
* Step ~2500 (Peak): ~0.35
* Step 5000: ~0.30
* Step 10000: ~0.15
* Step 15000: ~0.10
* Step 20000: ~0.05
* **Shaded Region:** The orange shaded band is narrowest at the start and end, and widest around the peak (steps 2000-5000), indicating greater variance in the R² metric during the period of its highest value.
### Key Observations
1. **Inverse Post-Peak Relationship:** After approximately 2,500 training steps, the two metrics move in opposite directions. Information gain continues to increase, while the R² value decreases.
2. **Early Peak of R²:** The R² value reaches its maximum very early in the training process (within the first 15% of the displayed steps) and never recovers to that level.
3. **Plateauing Information Gain:** The rate of increase for Information gain slows significantly after 10,000 steps, suggesting diminishing returns in this metric with further training.
4. **Variance Correlation:** The uncertainty (shaded region) in the R² measurement is highest when the metric itself is at its peak.
### Interpretation
This chart illustrates a potential trade-off or decoupling of two model performance indicators during training. The steady rise in **Information gain** suggests the model is consistently learning and extracting more signal from the data as training progresses.
However, the early peak and subsequent decline of the **R² value** is a critical anomaly. R² typically measures how well the model's predictions explain the variance in the data. A declining R² alongside increasing information gain could indicate several scenarios:
* **Overfitting to Noise:** The model may be learning increasingly specific patterns (gaining information) that do not generalize well to the underlying data structure, causing its explanatory power (R²) on a validation set to drop.
* **Changing Data Distribution:** If the training data distribution shifts, the model might gain information about the new data while its fit to the original target variance diminishes.
* **Metric Sensitivity:** The two metrics may be capturing fundamentally different aspects of model performance. Information gain might be measuring predictive power in an information-theoretic sense, while R² is a specific statistical measure of fit.
The shaded region around the R² line implies that this peaking-and-decaying behavior is a consistent pattern across multiple training runs, not a one-off fluke. The key takeaway for a practitioner would be to investigate why the model's explanatory power (R²) deteriorates so early and whether the continued increase in information gain is desirable or a sign of problematic learning.