## Line Graph: Information Gain vs R² Values Over Training Steps
### Overview
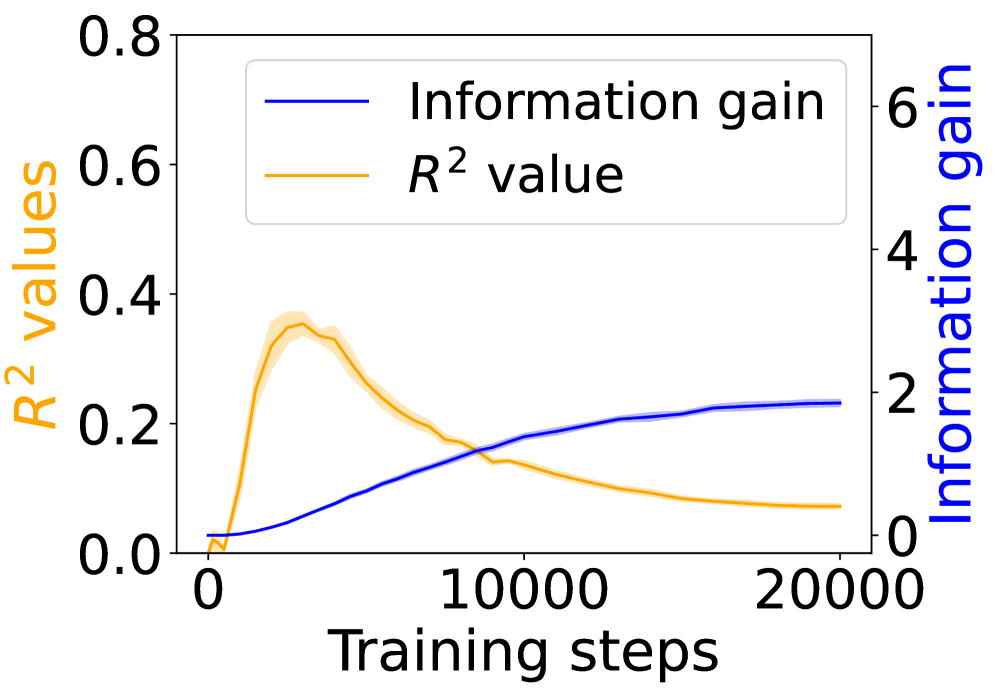
The graph depicts two metrics tracked during training: **R² values** (left y-axis) and **Information gain** (right y-axis), plotted against **Training steps** (x-axis from 0 to 20,000). The blue line represents Information gain, while the orange line represents R² values. The legend is positioned in the top-left corner.
### Components/Axes
- **X-axis**: Training steps (0 to 20,000, linear scale).
- **Left Y-axis**: R² values (0 to 0.8, linear scale).
- **Right Y-axis**: Information gain (0 to 6, linear scale).
- **Legend**:
- Blue line: Information gain.
- Orange line: R² value.
### Detailed Analysis
1. **R² Values (Orange Line)**:
- Starts near 0 at 0 steps.
- Peaks at ~0.35 around 5,000 steps.
- Declines steadily to ~0.05 by 20,000 steps.
- Shaded area (confidence interval) widens initially, then narrows.
2. **Information Gain (Blue Line)**:
- Begins at 0 and increases monotonically.
- Reaches ~2.5 by 20,000 steps.
- Slope flattens after ~15,000 steps.
3. **Key Intersection**:
- Lines cross near 10,000 steps, where both metrics are ~0.25 (R²) and ~2 (Information gain).
### Key Observations
- **Inverse Relationship**: R² values peak early and decline, while Information gain rises steadily.
- **Divergence**: After 10,000 steps, R² values drop below 0.2, while Information gain continues to increase.
- **Saturation**: Information gain plateaus near 2.5 after 15,000 steps, suggesting diminishing returns.
### Interpretation
The data suggests a trade-off between model performance (R²) and information-theoretic efficiency (Information gain). The initial rise in R² indicates improving model fit, but its subsequent decline implies overfitting or diminishing returns in capturing data variance. Meanwhile, Information gain’s steady increase suggests the model is learning new patterns, but these may not translate to better R² performance. This could indicate:
- **Overfitting**: The model prioritizes memorizing noise over generalizable patterns.
- **Metric Misalignment**: R² may not fully capture the model’s utility if the data has complex, non-linear relationships.
- **Resource Allocation**: Further training steps yield minimal R² gains but continue to extract information, possibly at the cost of generalization.
The divergence highlights the need to balance model complexity with validation metrics, especially in scenarios where Information gain (e.g., feature importance) is prioritized over traditional performance metrics like R².