## Scatter Plot: Accuracy vs. EAcc
### Overview
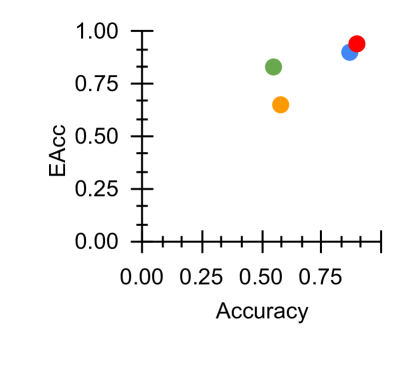
The image is a scatter plot showing the relationship between "Accuracy" on the x-axis and "EAcc" on the y-axis. There are four data points, each represented by a different color: red, blue, green, and orange. The data points are clustered in the upper-right quadrant of the plot, indicating a positive correlation between Accuracy and EAcc.
### Components/Axes
* **X-axis:** "Accuracy" with a scale from 0.00 to 1.00, incrementing by 0.25.
* **Y-axis:** "EAcc" with a scale from 0.00 to 1.00, incrementing by 0.25.
* **Data Points:** Four colored data points: red, blue, green, and orange. There is no legend provided to indicate what each color represents.
### Detailed Analysis
* **Red Data Point:** Located at approximately Accuracy = 0.85, EAcc = 0.95.
* **Blue Data Point:** Located at approximately Accuracy = 0.80, EAcc = 0.90.
* **Green Data Point:** Located at approximately Accuracy = 0.55, EAcc = 0.80.
* **Orange Data Point:** Located at approximately Accuracy = 0.55, EAcc = 0.65.
### Key Observations
* The red and blue data points are clustered closely together in the upper-right corner, indicating high accuracy and EAcc values.
* The green and orange data points are located closer to the center of the plot, indicating lower accuracy and EAcc values compared to the red and blue points.
* There is a noticeable gap between the red/blue cluster and the green/orange cluster.
### Interpretation
The scatter plot suggests a positive correlation between Accuracy and EAcc. The red and blue data points represent scenarios with high accuracy and EAcc, while the green and orange data points represent scenarios with lower accuracy and EAcc. The clustering of the data points suggests that there may be distinct performance levels or categories represented by the different colors. Without a legend, it is impossible to determine what each color represents. The gap between the clusters could indicate a threshold effect or a significant difference in the underlying conditions or parameters that lead to the observed performance.