## Bar Chart: Computation FLOPs Comparison for FedProto and FedMRL on CIFAR-10 and CIFAR-100
### Overview
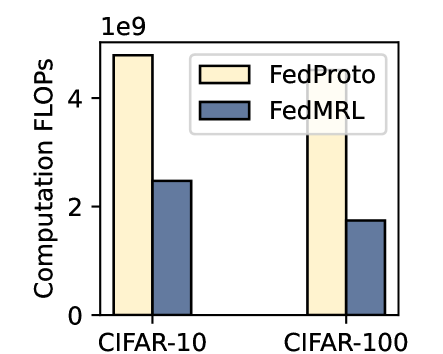
The image is a bar chart comparing the computational cost (in FLOPs) of two federated learning methods, **FedProto** and **FedMRL**, across two datasets: **CIFAR-10** and **CIFAR-100**. The y-axis represents "Computation FLOPs" on a logarithmic scale (up to 1e9), while the x-axis lists the datasets. The legend is positioned in the top-right corner, with **FedProto** represented by a light yellow bar and **FedMRL** by a blue bar.
---
### Components/Axes
- **Y-axis**: "Computation FLOPs" (logarithmic scale, 0 to 1e9).
- **X-axis**: Two categories: **CIFAR-10** (left) and **CIFAR-100** (right).
- **Legend**:
- **FedProto**: Light yellow (top-right legend).
- **FedMRL**: Blue (top-right legend).
- **Title**: "1e9" (likely indicating the y-axis scale).
---
### Detailed Analysis
- **CIFAR-10**:
- **FedProto**: ~4.5e9 FLOPs (light yellow bar).
- **FedMRL**: ~2.5e9 FLOPs (blue bar).
- **CIFAR-100**:
- **FedProto**: ~4.8e9 FLOPs (light yellow bar).
- **FedMRL**: ~1.8e9 FLOPs (blue bar).
**Trend Verification**:
- **FedProto** consistently shows higher FLOPs than **FedMRL** in both datasets.
- The gap between the two methods widens for **CIFAR-100** (difference: ~3e9 FLOPs) compared to **CIFAR-10** (difference: ~2e9 FLOPs).
---
### Key Observations
1. **FedProto** requires significantly more computational resources than **FedMRL** across both datasets.
2. The computational cost for **FedProto** remains relatively stable between datasets (~4.5e9 to 4.8e9 FLOPs), while **FedMRL** shows a larger relative reduction (~2.5e9 to 1.8e9 FLOPs) when moving from CIFAR-10 to CIFAR-100.
3. **FedMRL** demonstrates a more efficient scaling with dataset complexity compared to **FedProto**.
---
### Interpretation
The data suggests that **FedProto** is computationally more intensive than **FedMRL**, likely due to differences in their algorithmic design. The larger computational gap for **CIFAR-100** implies that **FedProto** may struggle more with larger or more complex datasets, whereas **FedMRL** maintains better efficiency. This could influence choices in resource-constrained federated learning scenarios, where **FedMRL** might be preferable for balancing performance and computational cost.
**Notable Anomalies**:
- The **FedMRL** bar for **CIFAR-100** is notably lower than its counterpart for **CIFAR-10**, indicating a potential optimization in handling larger datasets.
- The **FedProto** bars show minimal variation between datasets, suggesting a fixed computational overhead regardless of dataset size.