## Line Chart: I-Don't-Know Rate vs. Layer for Llama-3-8B and Llama-3-70B
### Overview
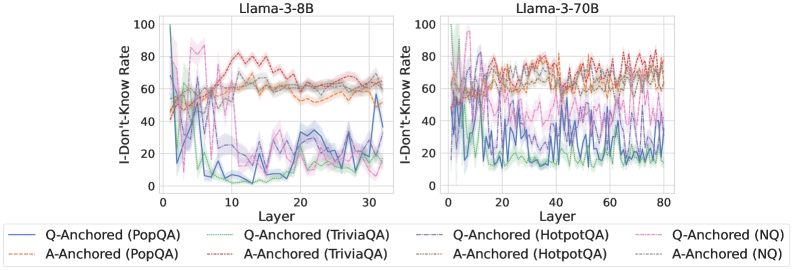
The image presents two line charts comparing the "I-Don't-Know Rate" across different layers of the Llama-3-8B and Llama-3-70B language models. The x-axis represents the layer number, and the y-axis represents the I-Don't-Know Rate, ranging from 0 to 100. Each chart displays six data series, representing Question-Anchored (Q-Anchored) and Answer-Anchored (A-Anchored) rates for different question answering datasets: PopQA, TriviaQA, HotpotQA, and NQ. Shaded regions around each line indicate uncertainty or variance.
### Components/Axes
* **Titles:**
* Left Chart: Llama-3-8B
* Right Chart: Llama-3-70B
* **Y-Axis:**
* Label: I-Don't-Know Rate
* Scale: 0 to 100, with tick marks at 0, 20, 40, 60, 80, and 100.
* **X-Axis:**
* Label: Layer
* Left Chart Scale: 0 to 30, with tick marks at 0, 10, 20, and 30.
* Right Chart Scale: 0 to 80, with tick marks at 0, 20, 40, 60, and 80.
* **Legend:** Located at the bottom of the image, spanning both charts.
* Q-Anchored (PopQA): Solid Blue Line
* A-Anchored (PopQA): Dashed Brown Line
* Q-Anchored (TriviaQA): Dotted Green Line
* A-Anchored (TriviaQA): Dash-Dotted Teal Line
* Q-Anchored (HotpotQA): Solid Purple Line
* A-Anchored (HotpotQA): Dashed Pink Line
* Q-Anchored (NQ): Dotted Red Line
* A-Anchored (NQ): Dash-Dotted Gray Line
### Detailed Analysis
**Left Chart: Llama-3-8B**
* **Q-Anchored (PopQA) - Solid Blue Line:** Starts high (around 50), drops sharply to near 0 around layer 10, then fluctuates between 0 and 40 for the remaining layers.
* **A-Anchored (PopQA) - Dashed Brown Line:** Starts around 50, increases to around 70 by layer 10, and then remains relatively stable between 60 and 70 for the rest of the layers.
* **Q-Anchored (TriviaQA) - Dotted Green Line:** Starts high (around 60), drops sharply to near 0 around layer 10, then fluctuates between 0 and 20 for the remaining layers.
* **A-Anchored (TriviaQA) - Dash-Dotted Teal Line:** Starts around 60, drops sharply to near 0 around layer 10, then fluctuates between 0 and 20 for the remaining layers.
* **Q-Anchored (HotpotQA) - Solid Purple Line:** Starts around 40, fluctuates significantly between 0 and 40 throughout all layers.
* **A-Anchored (HotpotQA) - Dashed Pink Line:** Starts around 50, increases to around 80 by layer 10, and then fluctuates between 70 and 90 for the rest of the layers.
* **Q-Anchored (NQ) - Dotted Red Line:** Starts around 50, increases to around 80 by layer 10, and then fluctuates between 70 and 90 for the rest of the layers.
* **A-Anchored (NQ) - Dash-Dotted Gray Line:** Starts around 50, increases to around 60 by layer 10, and then fluctuates between 60 and 70 for the rest of the layers.
**Right Chart: Llama-3-70B**
* **Q-Anchored (PopQA) - Solid Blue Line:** Starts high (around 50), drops sharply to near 0 around layer 10, then fluctuates between 0 and 40 for the remaining layers.
* **A-Anchored (PopQA) - Dashed Brown Line:** Starts around 50, increases to around 70 by layer 10, and then remains relatively stable between 60 and 70 for the rest of the layers.
* **Q-Anchored (TriviaQA) - Dotted Green Line:** Starts high (around 60), drops sharply to near 0 around layer 10, then fluctuates between 0 and 20 for the remaining layers.
* **A-Anchored (TriviaQA) - Dash-Dotted Teal Line:** Starts around 60, drops sharply to near 0 around layer 10, then fluctuates between 0 and 20 for the remaining layers.
* **Q-Anchored (HotpotQA) - Solid Purple Line:** Starts around 40, fluctuates significantly between 0 and 40 throughout all layers.
* **A-Anchored (HotpotQA) - Dashed Pink Line:** Starts around 50, increases to around 80 by layer 10, and then fluctuates between 70 and 90 for the rest of the layers.
* **Q-Anchored (NQ) - Dotted Red Line:** Starts around 50, increases to around 80 by layer 10, and then fluctuates between 70 and 90 for the rest of the layers.
* **A-Anchored (NQ) - Dash-Dotted Gray Line:** Starts around 50, increases to around 60 by layer 10, and then fluctuates between 60 and 70 for the rest of the layers.
### Key Observations
* For both Llama-3-8B and Llama-3-70B, the Q-Anchored (PopQA) and Q-Anchored (TriviaQA) rates drop significantly in the early layers.
* The A-Anchored (HotpotQA) and Q-Anchored (NQ) rates tend to be higher and more stable across layers.
* The A-Anchored (PopQA) and A-Anchored (NQ) rates are relatively stable across layers.
* The right chart (Llama-3-70B) has a longer x-axis, indicating more layers in the model.
### Interpretation
The charts illustrate how the "I-Don't-Know Rate" varies across different layers of the Llama-3-8B and Llama-3-70B models, depending on whether the question or answer is used as the anchor. The significant drop in Q-Anchored (PopQA) and Q-Anchored (TriviaQA) rates in the early layers suggests that the model quickly learns to handle these types of questions. The higher and more stable rates for A-Anchored (HotpotQA) and Q-Anchored (NQ) might indicate that these question types are more challenging for the model, requiring more layers to process effectively. The longer x-axis for Llama-3-70B suggests that the larger model has more capacity to learn and potentially handle more complex questions. The shaded regions indicate the variance in the I-Don't-Know Rate, which could be due to variations in the training data or the model's internal state.